
Courtesy of Serpstat from Pexels
Foundations have been badly underserved in terms of available financial benchmarking resources. Coverage of foundations tends to focus mainly on where donations dollars are going without much attention paid to what happens to the money that stays in foundations’ endowments. The few reports that are available either 1) only describe the largest foundations, 2) are buried in academic papers, or 3) come from episodic survey results, making it exceedingly difficult for foundations to benchmark themselves to similar foundations. The core reason for the lack of comparative statistics has been that gathering data is a time consuming and expensive exercise, so the expedient approach was to pick a small group (typically the largest) and extrapolate from this narrow base. While this approach may be sufficient for general performance purposes, it misses the mark when foundations want more granular information on their standing vis-a-vis their peers.
Instead of choosing small group and taking a top down approach, FoundationMark approached the problem from the opposite perspective— building from the bottom up by constructing a database consisting of all foundations with over $1 million (over 40,000 in total). Armed with a complete data set, FoundationMark is able to design the most comprehensive peer groups ever assembled. Furthermore, the underlying data is updated continuously as new data becomes available, keeping the peer group information fresh, relevant, and easy to access.
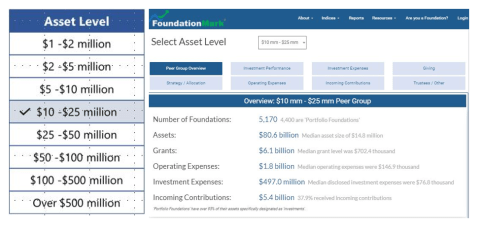
FoundationMark peer group data allows any foundation to view financial metrics such as investment performance, operating expenses, payout ratios, and more based on asset size. Foundations of all sizes and strategies can easily see where they stand versus peers and learn where they are doing well or areas that might need attention.
So, what is FoundationMark and what can we learn from this benchmarking data? John Seitz, Founder and CEO of FoundationMark, shares more about the importance of this data below.
Can you tell us about FoundationMark and what led to the peer group data?
FoundationMark was born from our frustration over the lack of sources available to track the investment performance of foundations. Why should a $3 million or $30 million foundation compare itself to a $3 billion foundation, instead of other $3 million or $30 million foundations? We thought, “What if we could create a way to track the investment performance of all foundations?”. So, we rolled up our sleeves and built it. We have tens of millions of individual data points pulled from foundations’ own tax filings that we use to calculate returns and other metrics on over 40,000 foundations, which is the complete universe of foundations that have over $1 million in assets, accounting for over 98% of all foundation assets. With the data in place, we can group foundations by common characteristics, such as asset size, investment strategy, and geography. This approach enables foundations to compare themselves to a truly representative group of similar sized foundations, as well as provide important information to the nonprofit community at large.
Aren’t all foundations alike?
We mentioned above that we track over 40,000 foundations. To put that into context, consider that there are roughly 2,000 colleges in the US, so there are twenty times as many foundations as college endowments. Imagine an Ivy League with 160 members. Many people assume that all foundations are funded by a single gift, often a bequest, and then operate into perpetuity, disbursing 5% a year. But a look at the underlying data reveals that about one-third of foundations receive incoming contributions (unlike operating charities, foundations do not solicit donations), and payout 8% of assets in aggregate (median is closer to 6%). Foundation portfolio holdings run the gamut from conventional stock and bonds to alternative assets like private equity and hedge funds. At extremes we have seen foundations that have all their assets in cash or a single stock, and even cryptocurrency. With such a diverse group, we thought it was important to get some benchmarking information in the hands of trustees to provide context and a framework for evaluating their foundation.
What type of metrics do you track?
Our primary focus is investment data. When we look at foundations, we see 40,000 distinct portfolios; consequently, the core metrics that we track are those you might expect to hear from an investment advisor: investment performance, asset allocation, and investment fees. In addition to investment metrics, we use the data from the foundations’ filings to calculate items like payout ratios, amounts paid for legal and accounting, and other operating expenses. All our data comes from foundation filings, so it is completely transparent.
Are there large differences in these metrics by asset size?
Intuitively we know that there are likely to be differences between a $1 million foundation and a $100 million foundation, besides the fact that one has one hundred times greater assets and grantmaking ability. These differences can be observed in expected places, such as larger foundations are more likely to have physical offices and paid staff members, but we have also seen examples of less intuitive data discovery; for example, that smaller foundations tend to have higher average payout ratios and fewer trustees.
In terms of investment performance, the data shows that that the largest foundation cohort (over $500 million) outperformed the smallest by over 150 basis points per year over the past 5 years. The biggest foundations tended to have more aggressive asset allocations, holding more in equity and equity linked products like hedge funds and private equity than smaller foundations and correspondingly less in cash and fixed income.
What is the biggest misconception about foundations investments?
The big foundations are actually the outliers, not the other way around. As we have noted above, the majority of research on foundations has been devoted to the largest one or two hundred foundations that have over a billion in assets. Therefore, it is natural to assume that smaller ones look a lot like the bigger ones, just at a smaller scale. However, if one was to look at the data, for example asset allocation, you would see that it is the $500 million cohort that is dramatically different from the others. So not only can it be inappropriate to compare all foundations to a single standard, it can be misleading.
Who is your audience and how can they use your data?
Our primary audience is the 150,000 trustees who collectively control over $1 trillion in foundation assets, as well as $5 billion a year in disclosed investment expenses. Our intent is for trustees to use the peer group data (as well as other FoundationMark resources) to get a better understanding of how other foundations like theirs are doing. We believe providing benchmarking resources will hopefully lead to better investment performance, which in turn leads to more money for philanthropic causes.
One piece of advice for foundations trustees?
One area that is far too often overlooked is investment fees. Money managers typically don’t like to call attention to their fees, making it difficult to compare one firm to another. The FoundationMark peer group data includes disclosed investment fee data, which is a good resource to understand the range of fees that others report. Foundations should know how much they are paying and ask themselves if it is appropriate.
What else can we learn?
We approach this question from the opposite direction—we essentially ask ourselves all kinds of questions about foundations and see if we have the data to find answers (which we usually do). For example:
- How much do foundations give away per year? 5% or more?
- How much money is in foundations by state? By County? City? In “real time”?
- What percentage of foundations pay trustees?
- How many foundations have just a single trustee?
- How much do foundations pay their investment managers?
- Which foundations received over $1 million in incoming contributions over the past 5 years?
- Which foundations have been increasing/decreasing payout?
- Which foundations have done a better job managing their assets than others?
For more information, read FoundationMark’s Peer Group Narrative for an example of how to understand and interpret the peer group data for a foundation of your own asset size. Access the data and build a personalized benchmarking tool here.
John Seitz is the Founder and CEO of FoundationMark.
The views and opinions expressed in individual blog posts are those of the author(s) and do not necessarily reflect the official policy or position of the National Center for Family Philanthropy.