Trends 2020: Governance and Staff

Courtesy of the Quixote Foundation
This excerpt from NCFP’s Trends 2020 study shares data and analysis regarding various US family foundation giving trends, including board composition, governance policies, staff composition, and much more.
How do family foundations choose who should serve on the board, and how they can prepare them for success when they assume this important role?
Board composition and the establishment of appropriate governance policies and practices are important decisions for all founders and boards. This section looks at evolving trends in each of these areas.
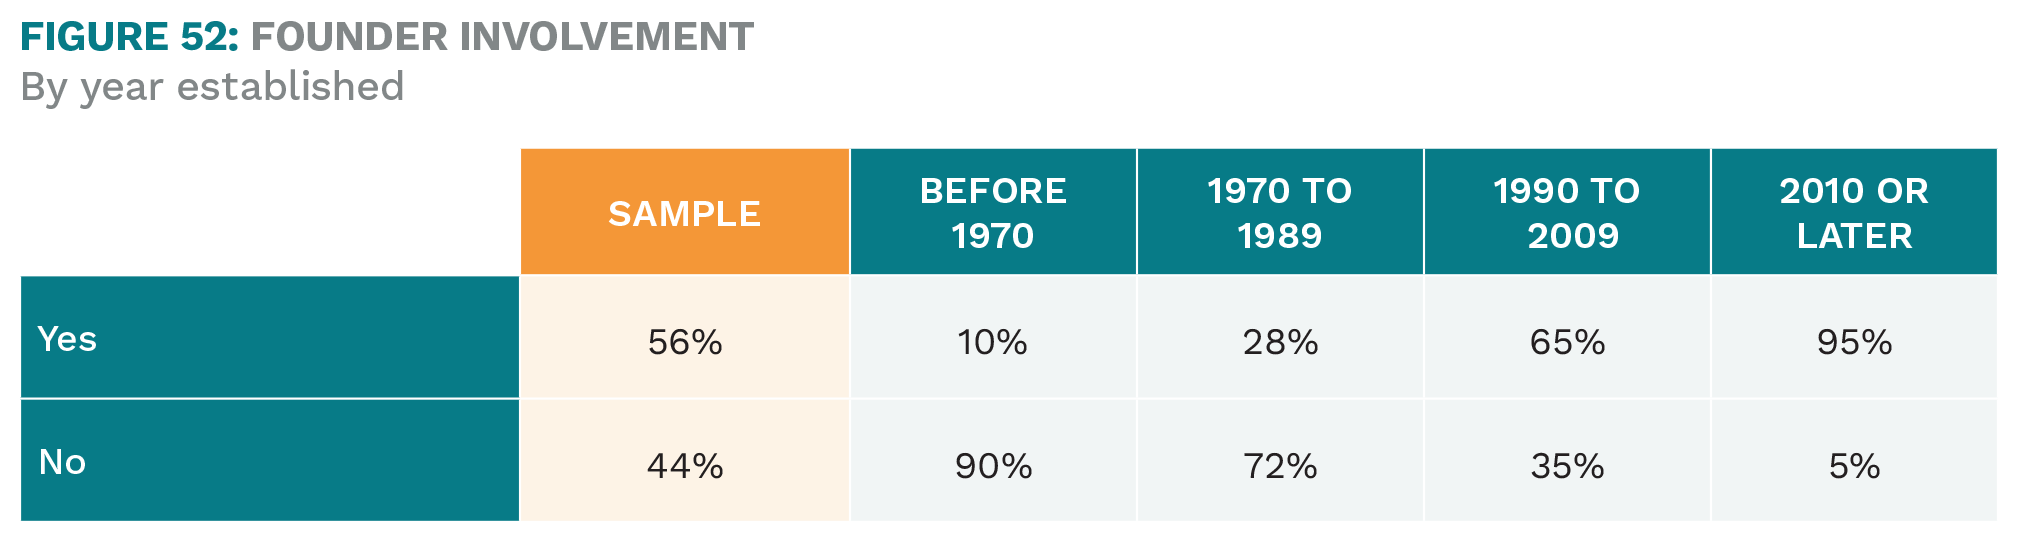
Board Composition: Founder Presence
Slightly more than half of all family foundations say that the founder is still actively involved in the foundation. As expected, this figure drops dramatically as the foundation ages (with only 10% of those foundations formed before 1970 reporting yes, the founder is still actively involved). For more on the impact and perspectives of founders, please see pages 26-33.
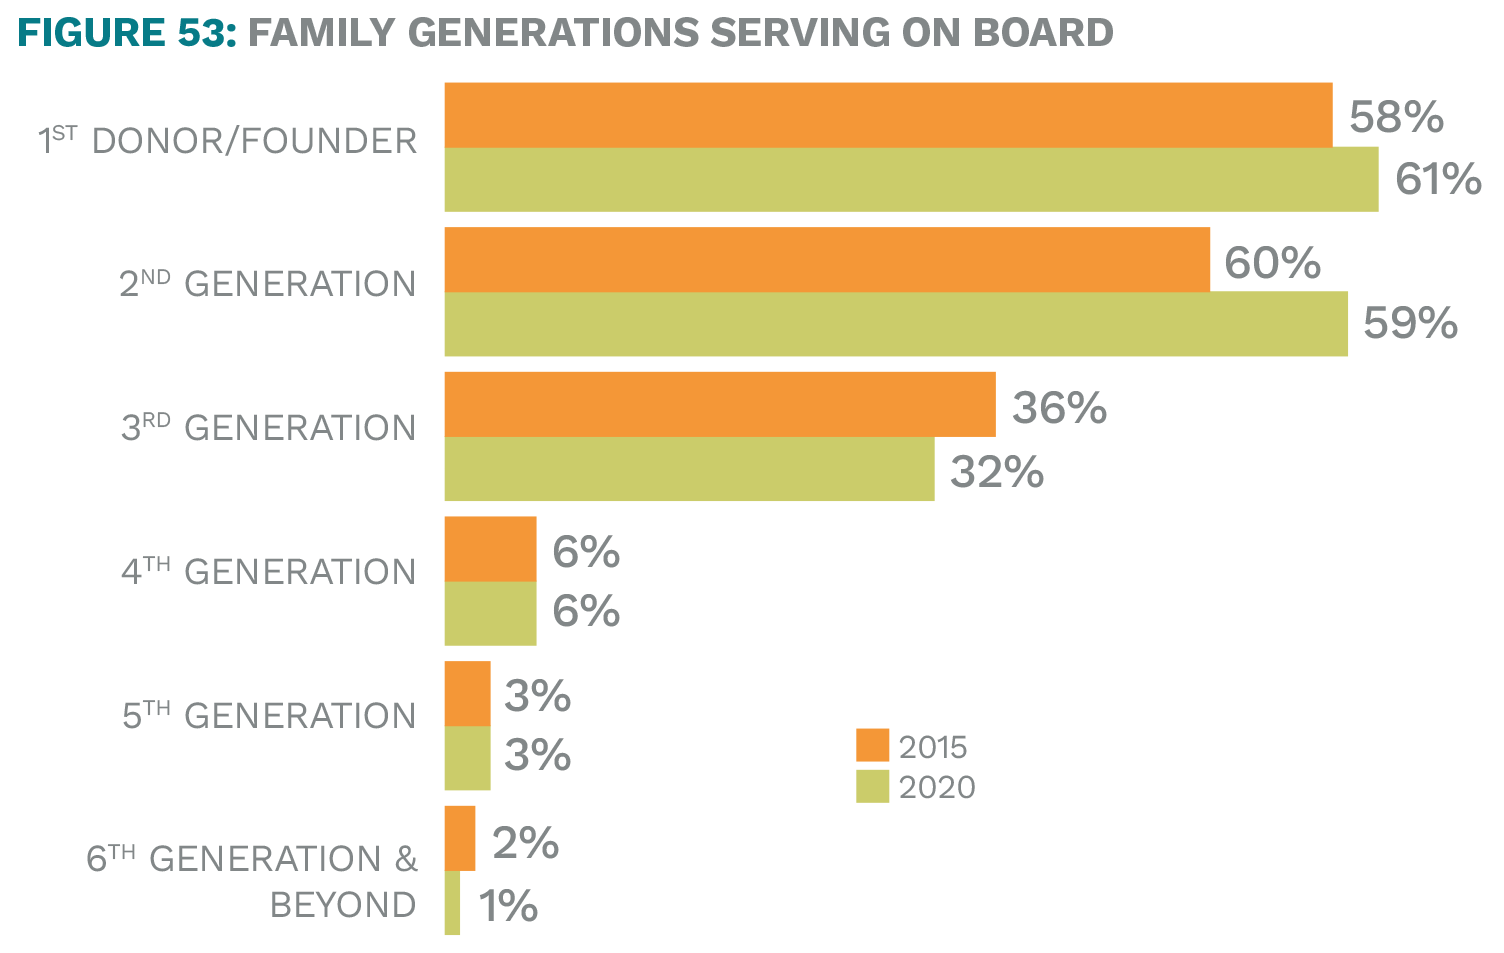
Board Composition: Generations Participating
More than half of all family foundations have multiple generations serving on their board. One in ten have three or more generations serving on the board. One-third have at least one member of the third generation on the board, but less than one in ten have family members from the fourth generation or beyond.
As expected, the third generation and beyond participates more among the oldest and largest family foundations.
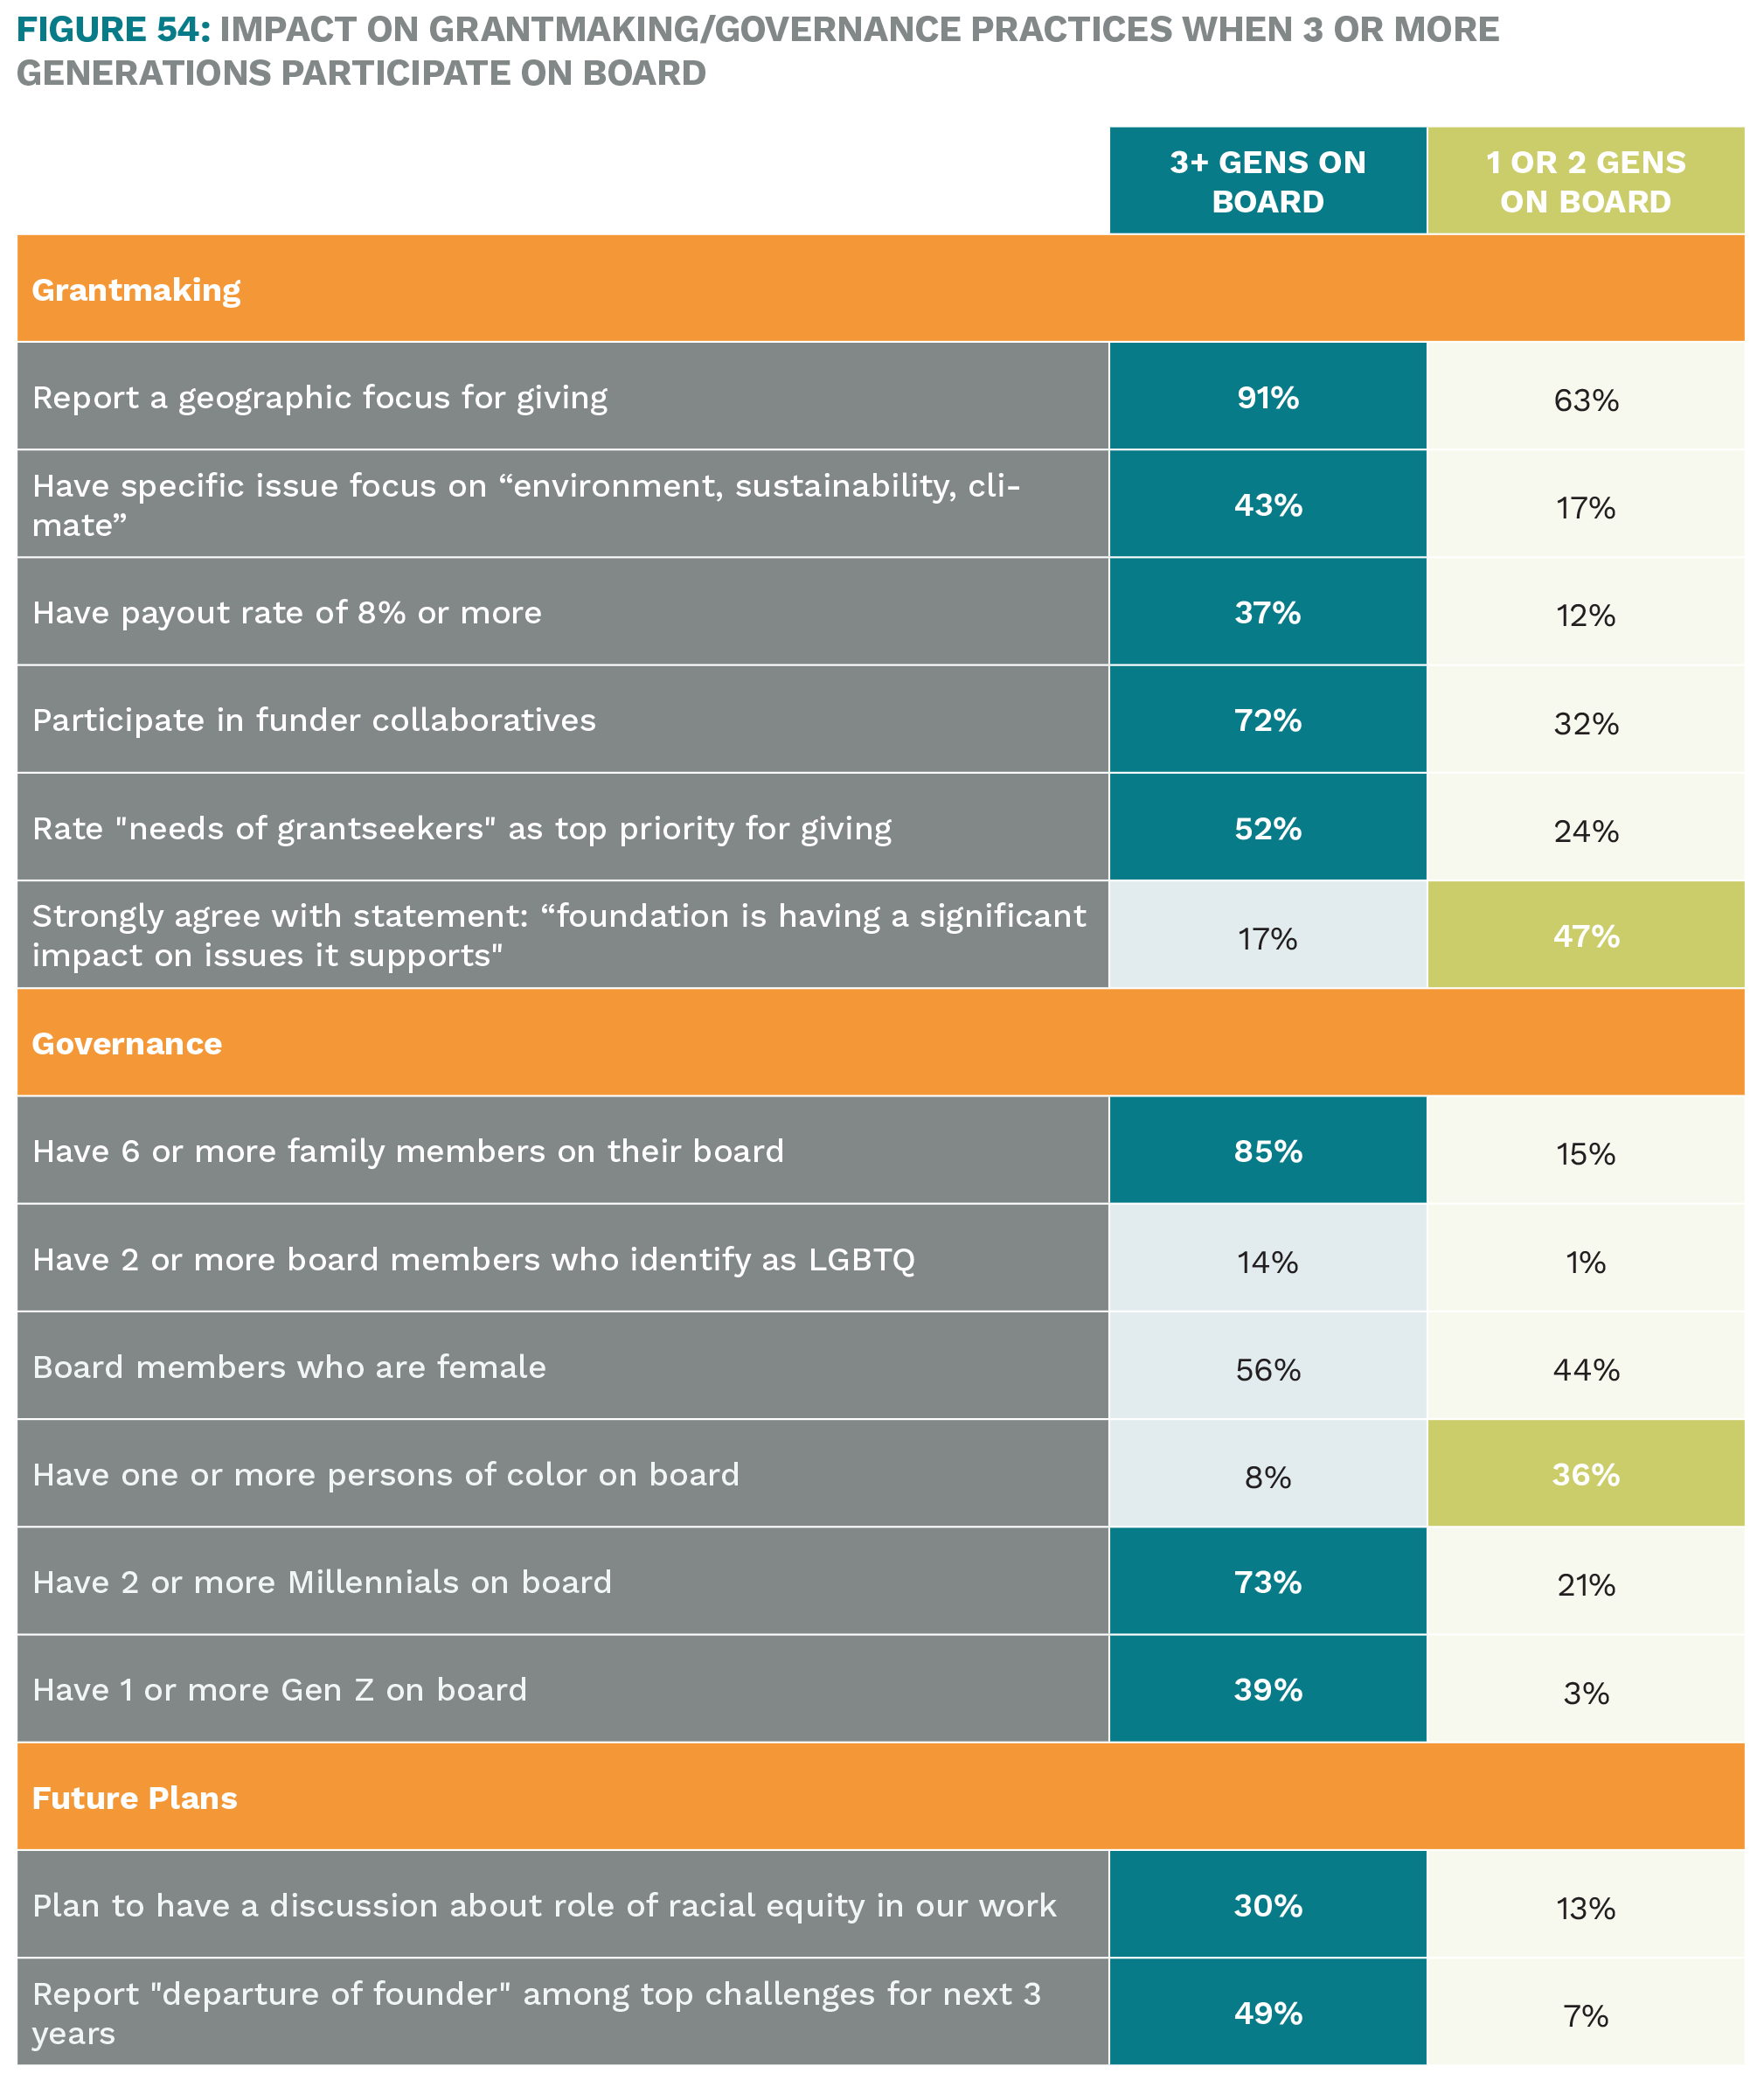
Family foundations with three or more generations on the board exhibit a variety of interesting characteristics, particularly with regard to overall board composition, payout rate, and future plans/ challenges, as shown in Figure 54.
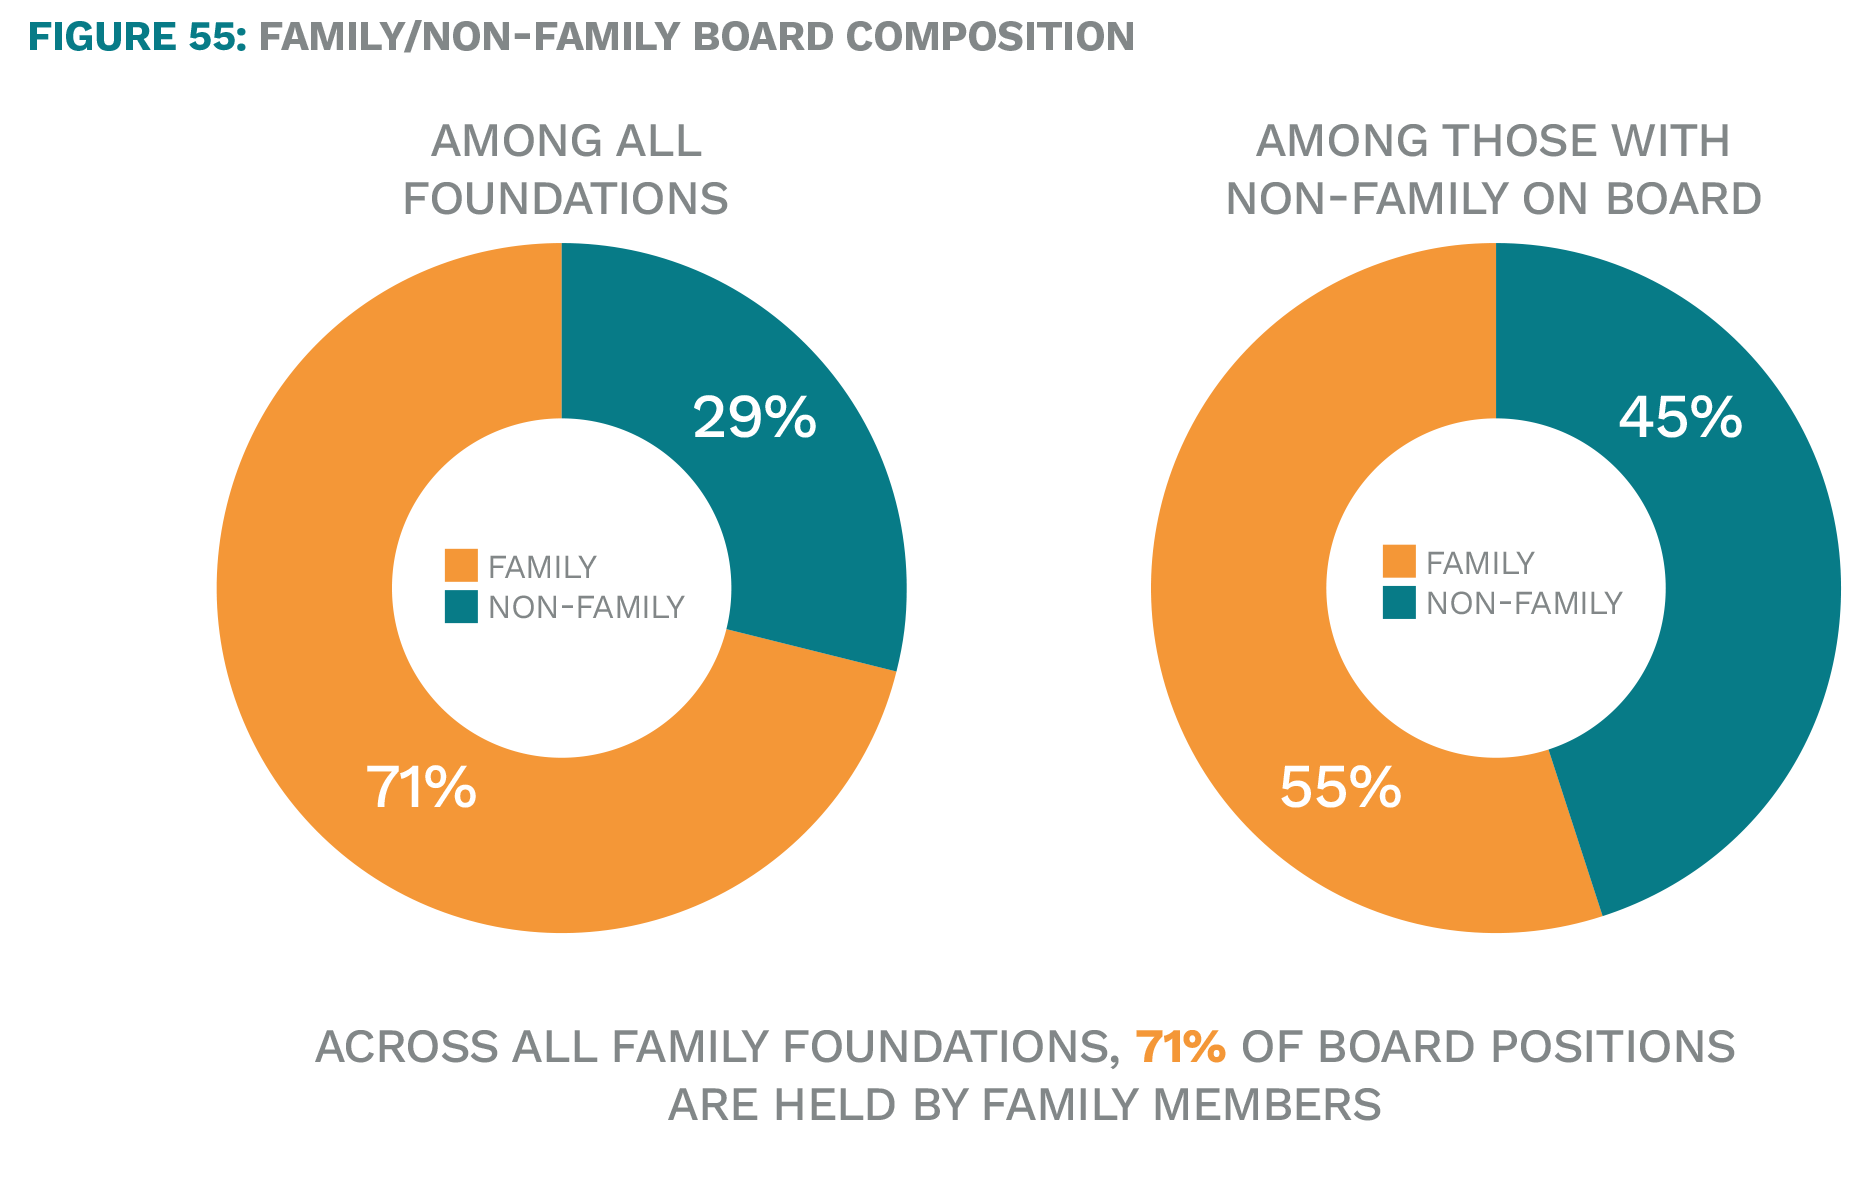
Board Composition: Family vs. Non-Family
Two-thirds of all family foundation boards include at least one non-family board member, consistent with 2015 results which found that 65% of family foundations had a least one non-family board member.
However, the total number and percentage of non-family board members appears to have grown significantly over the past five years. In 2015, 23% of respondents reported two or more non-family board members; in 2020, 26% of all family foundation have three to five non-family board members, and an additional 10% have six or more non-family members.
When it comes to involving non-family board members, additional highlights include:
- 79% of the largest family foundations (those with $200M or more) have at least one non-family board member.
- 56% of the largest family foundations report three or more non-family board members (compared to only 33% of those with less than $10M in assets).
- Approximately 40% of all family foundations created since 1990 have at least three non-family board members, compared to approximately 27% of those created prior to 1990.
- Among all family foundations that include non-family board members, non-family comprises about 45% of total board positions.
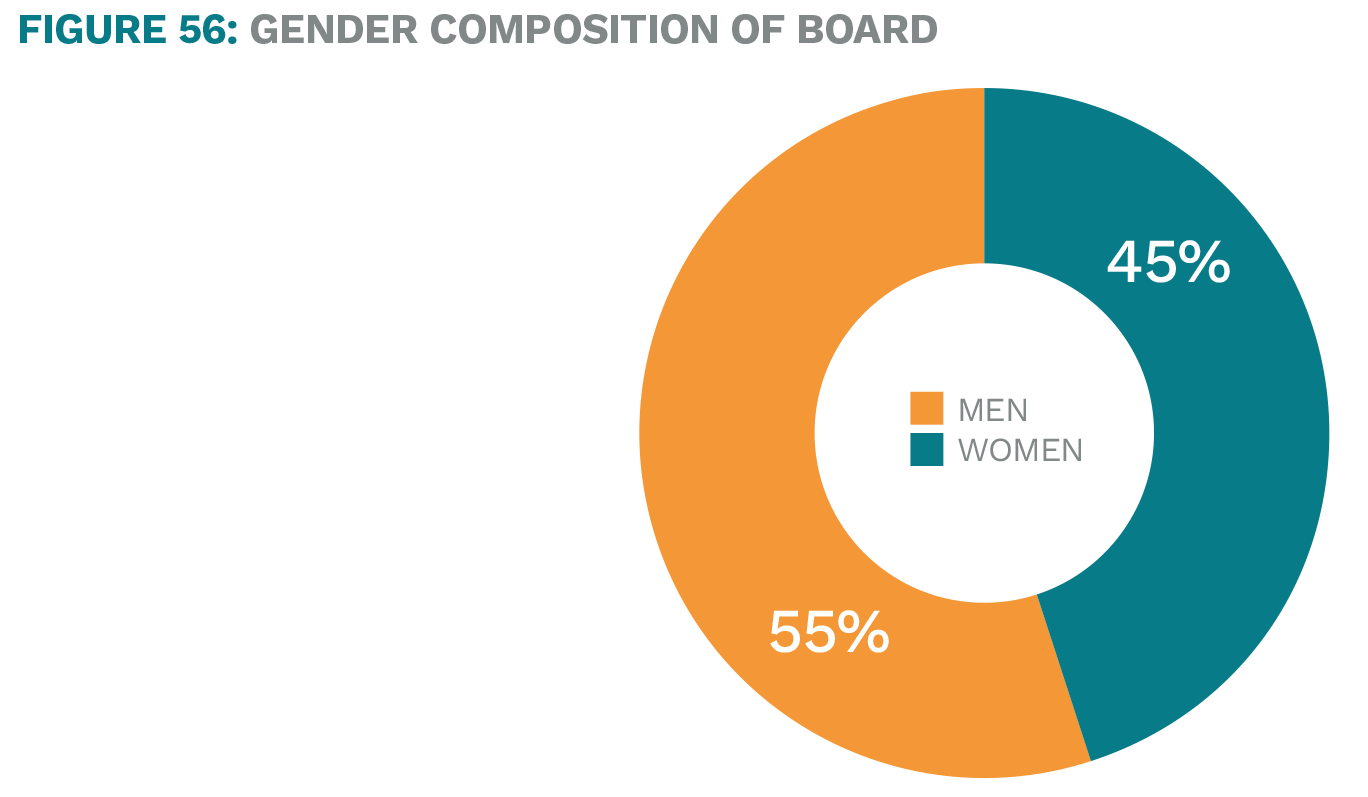
Board Composition: Gender
The gender distribution of family foundation boards skews slightly toward males, with about 45% of boards comprised of women and 55% men. Approximately one in ten include LGBTQ and/or gender non-conforming board members.
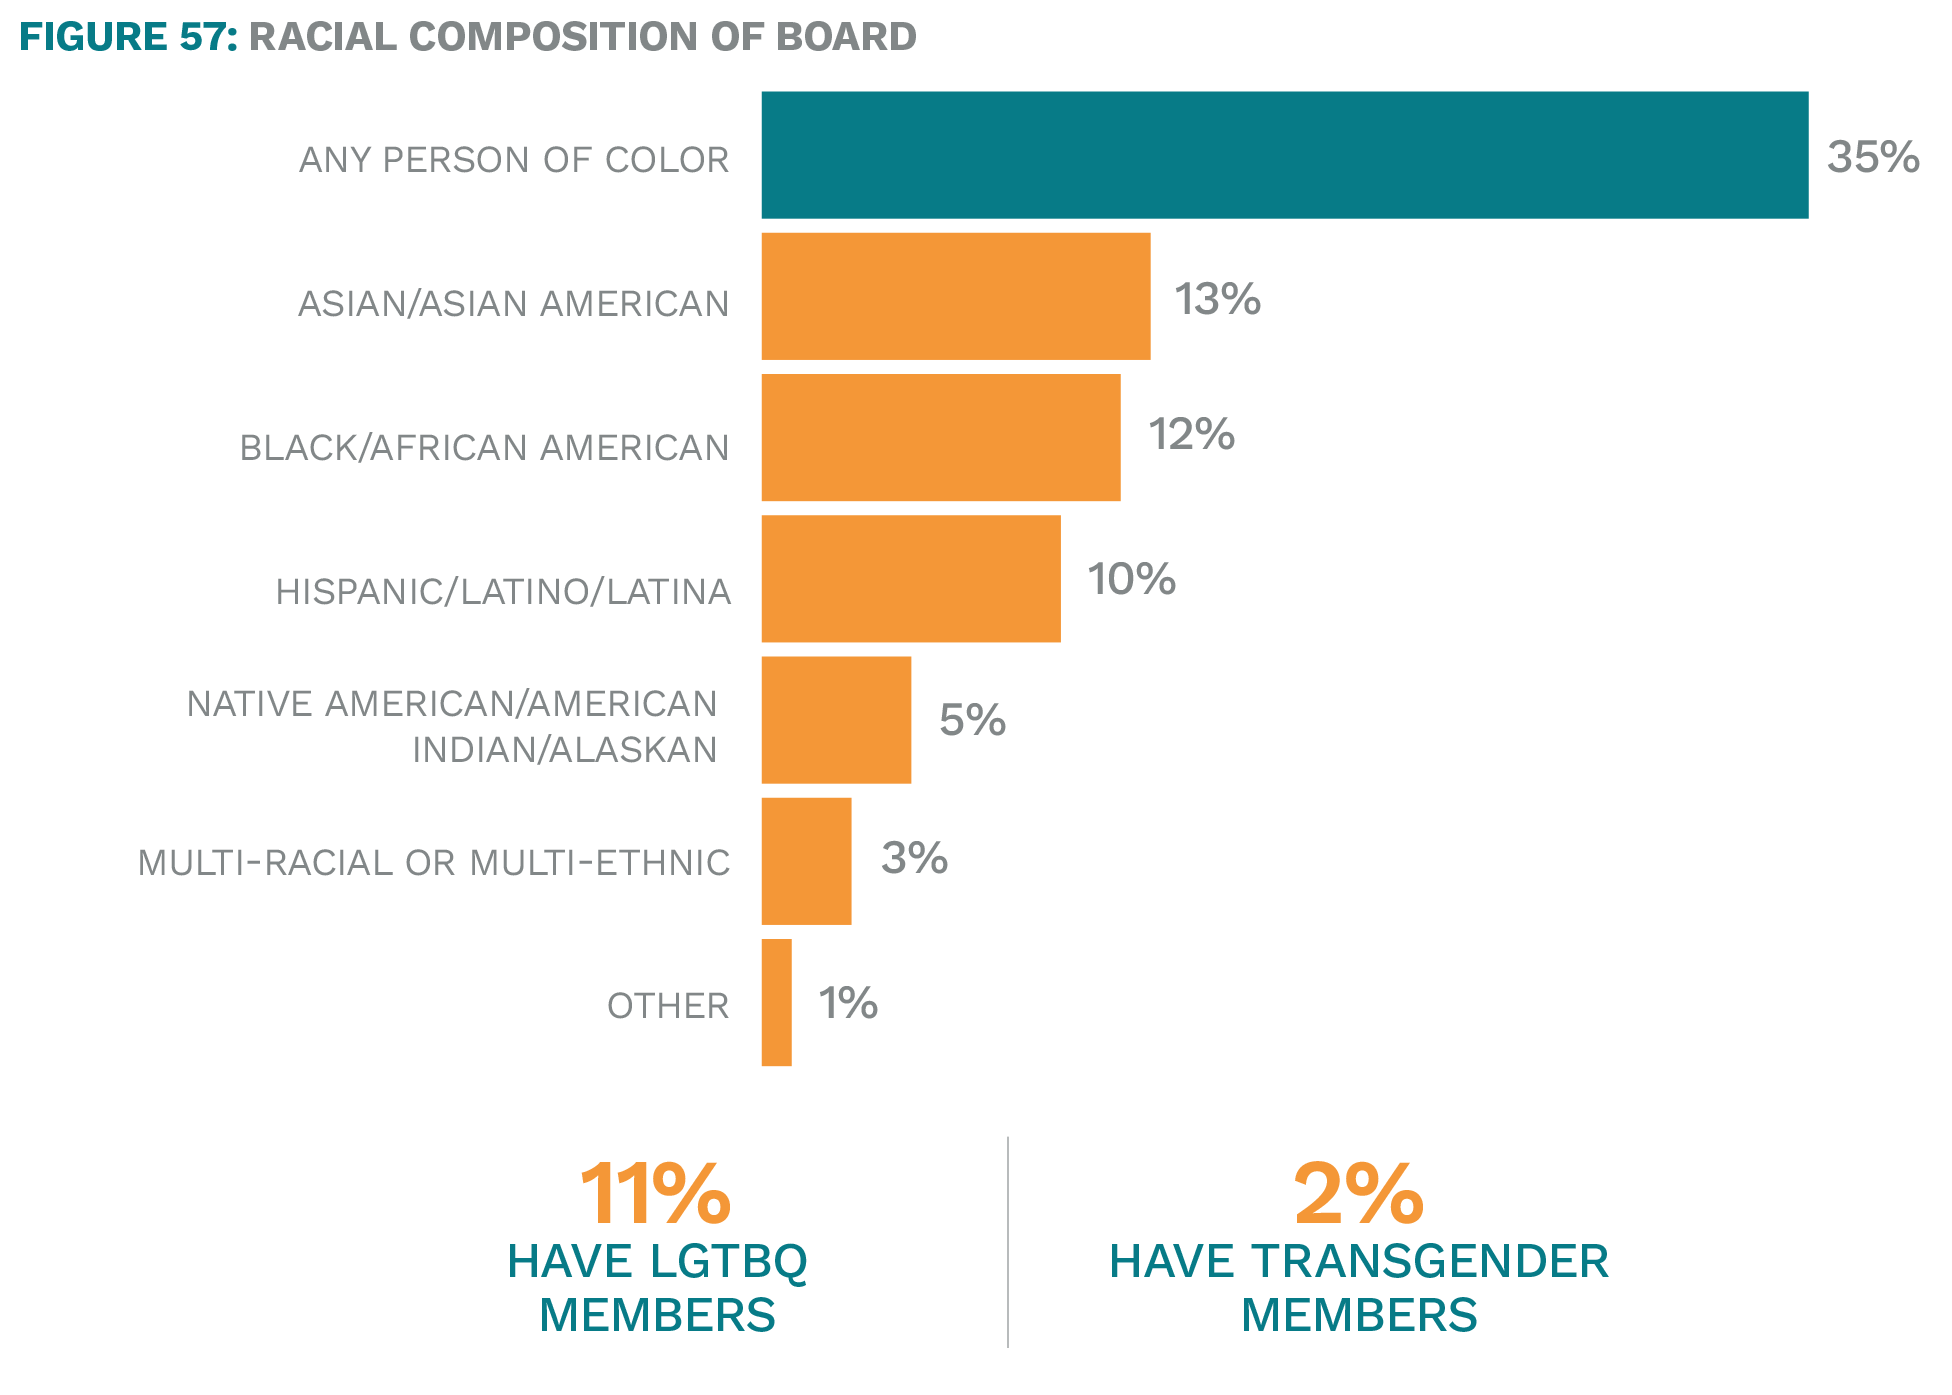
Board Composition: Racial and LGBTQ Identity
About one-third of foundation boards contain at least one person of color. Approximately one in ten include LGBTQ and/or gender non-conforming board members. Racial diversity is somewhat more common in larger and older family foundations.
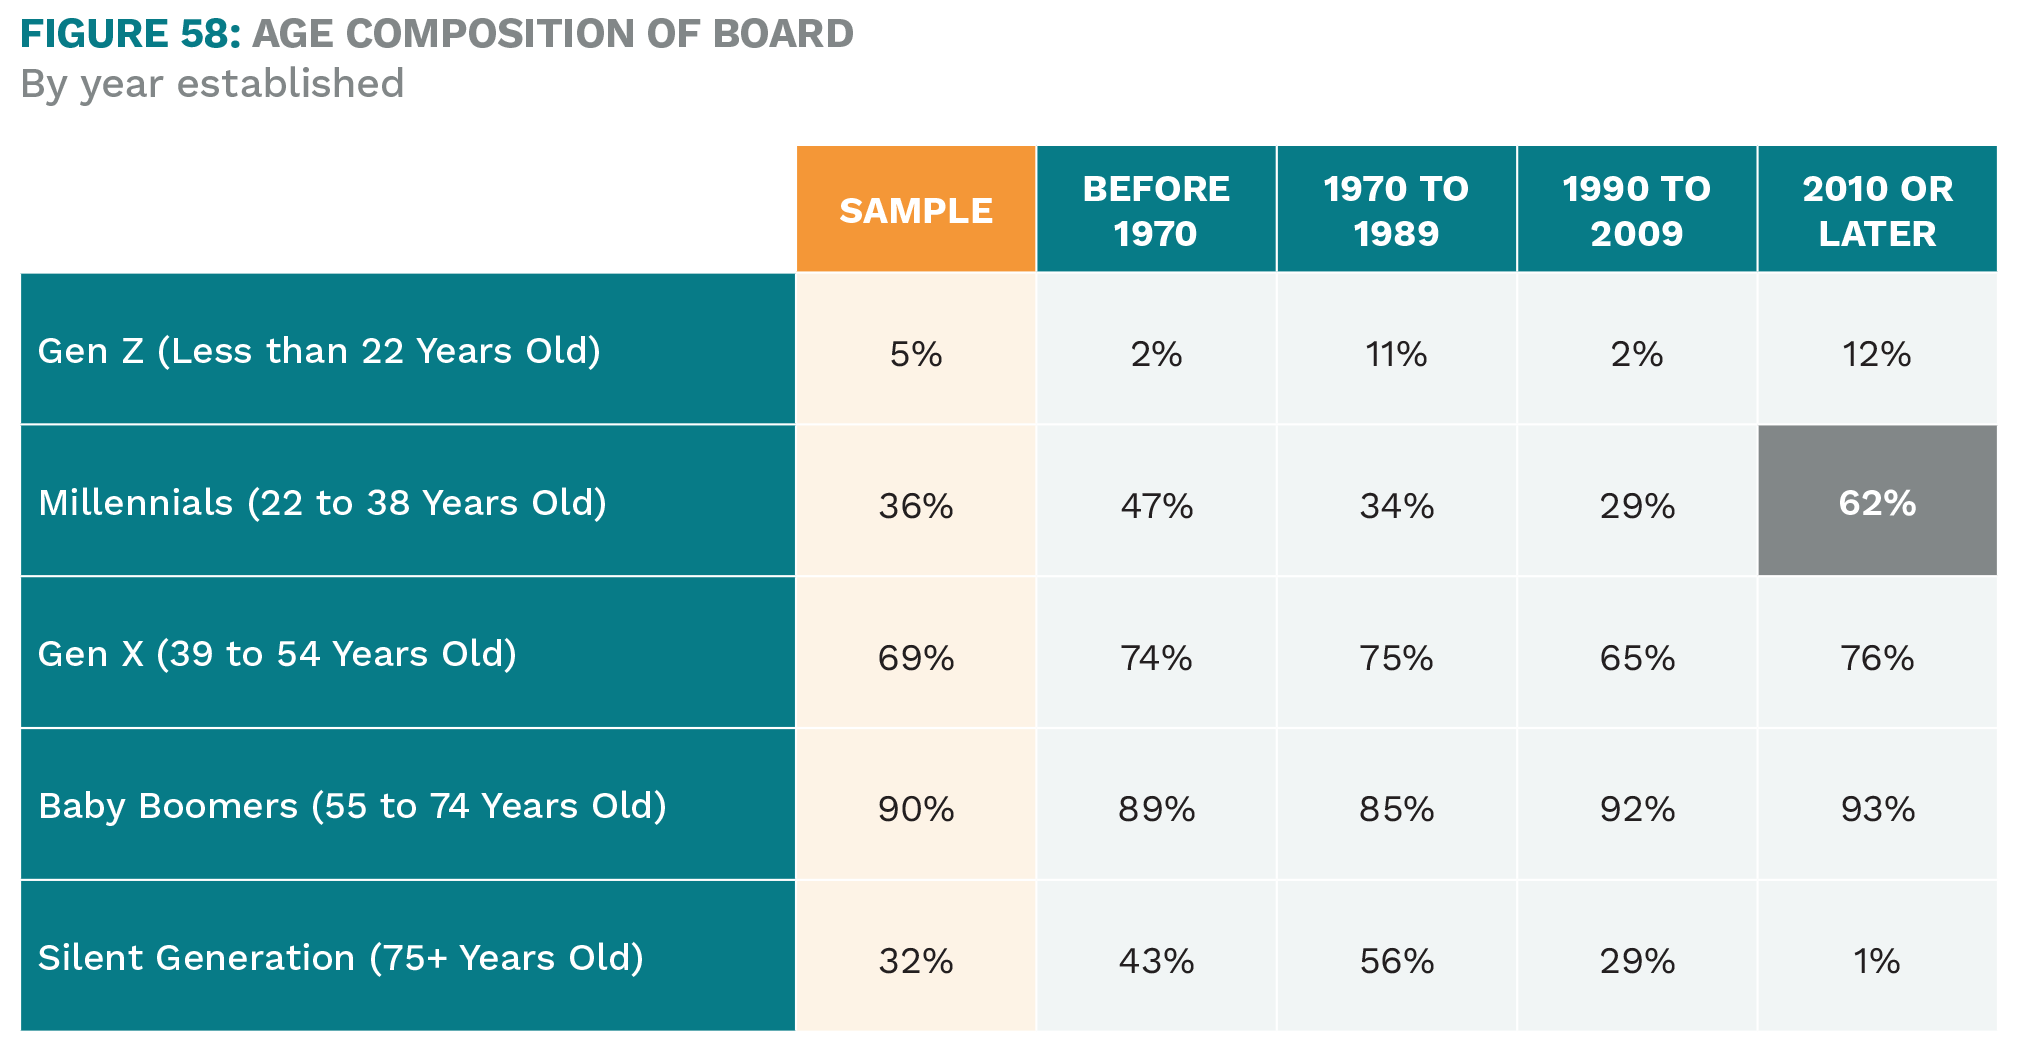
Board Composition: Ages and Generations
The vast majority of family foundations have at least one Baby Boomer (born 1946–64) board member, and most have Gen X members (born 1965–79). About one-third have Millennial (born 1980–2000) or Silent Generation (born between 1925–45) board members.
A much higher percentage of the youngest foundations have Millennial representation on their boards (62% have at least one and 52% have two or more).
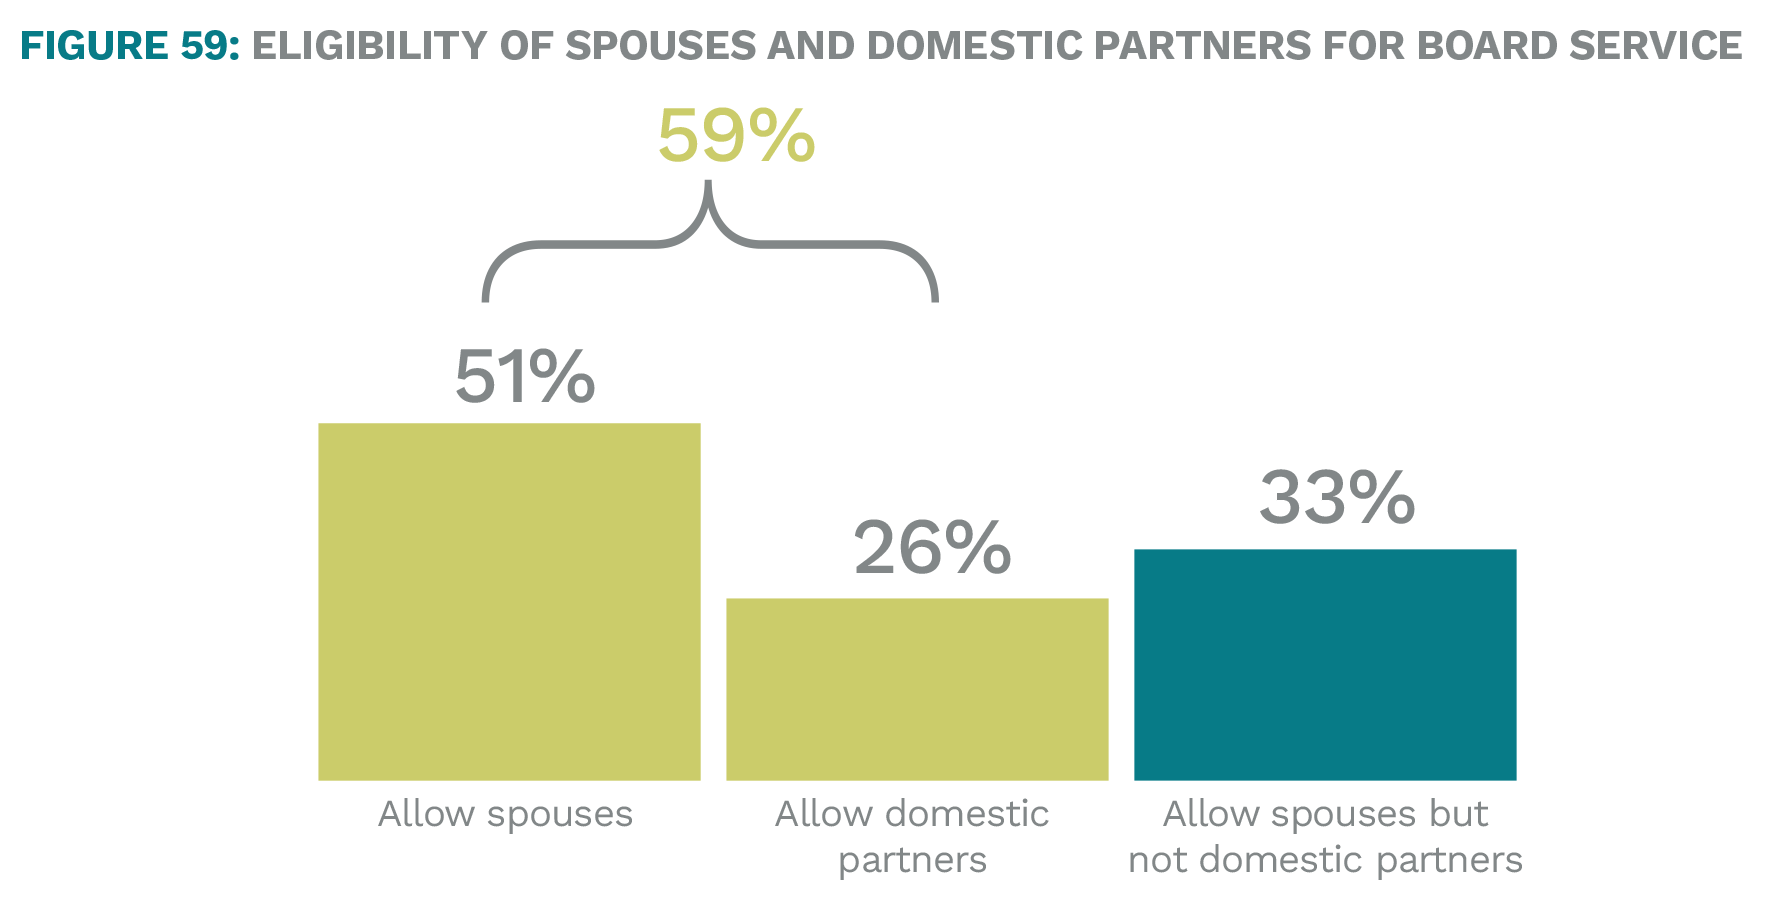
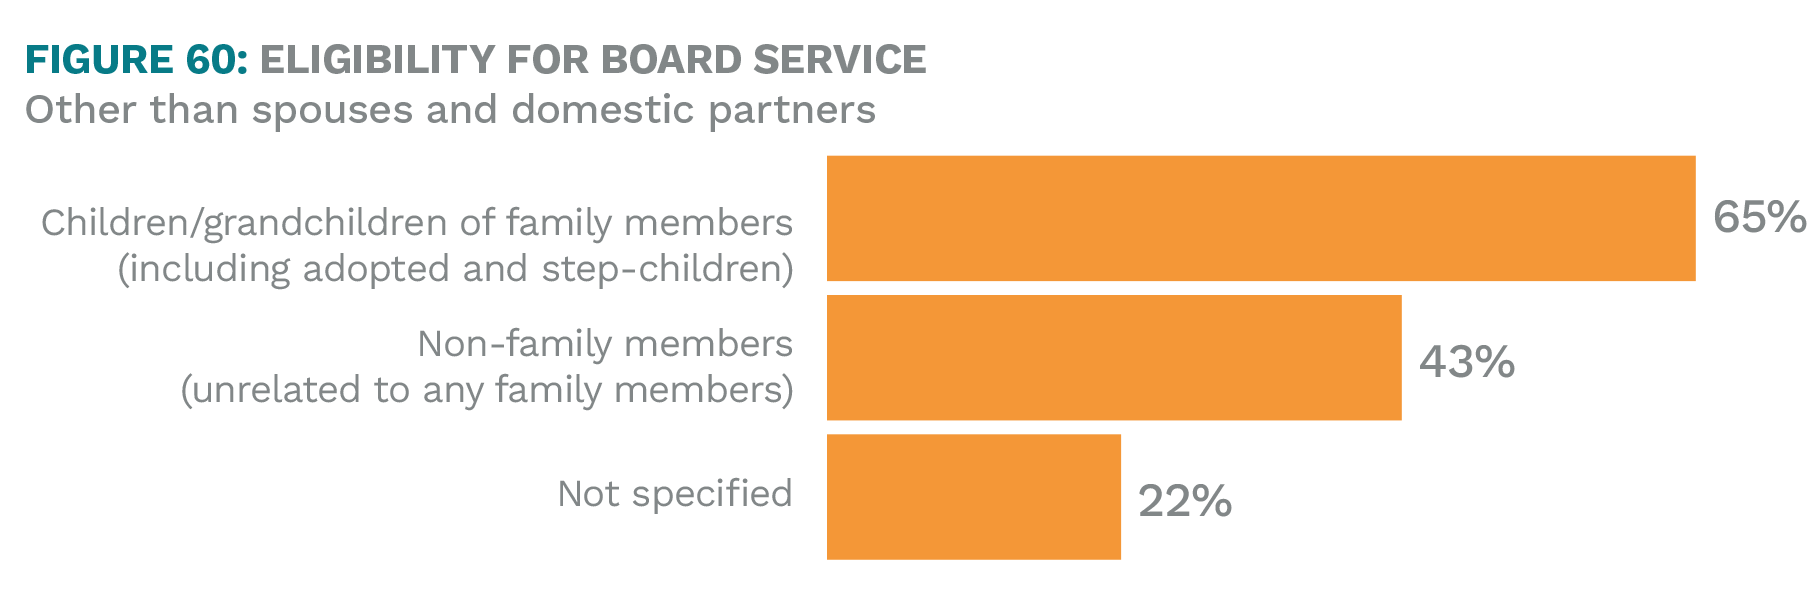
Who Can Serve on Board?
Nearly 60% allow spouses and/or domestic partners of donor family members to serve on the board, while one-third allow spouses but not domestic partners. These numbers are increases from 2015, when 40% allowed spouses and partners and 28% allowed only spouses.
Large foundations are notably more likely to permit domestic partners (40%) and non-family (62%) to serve on the board.
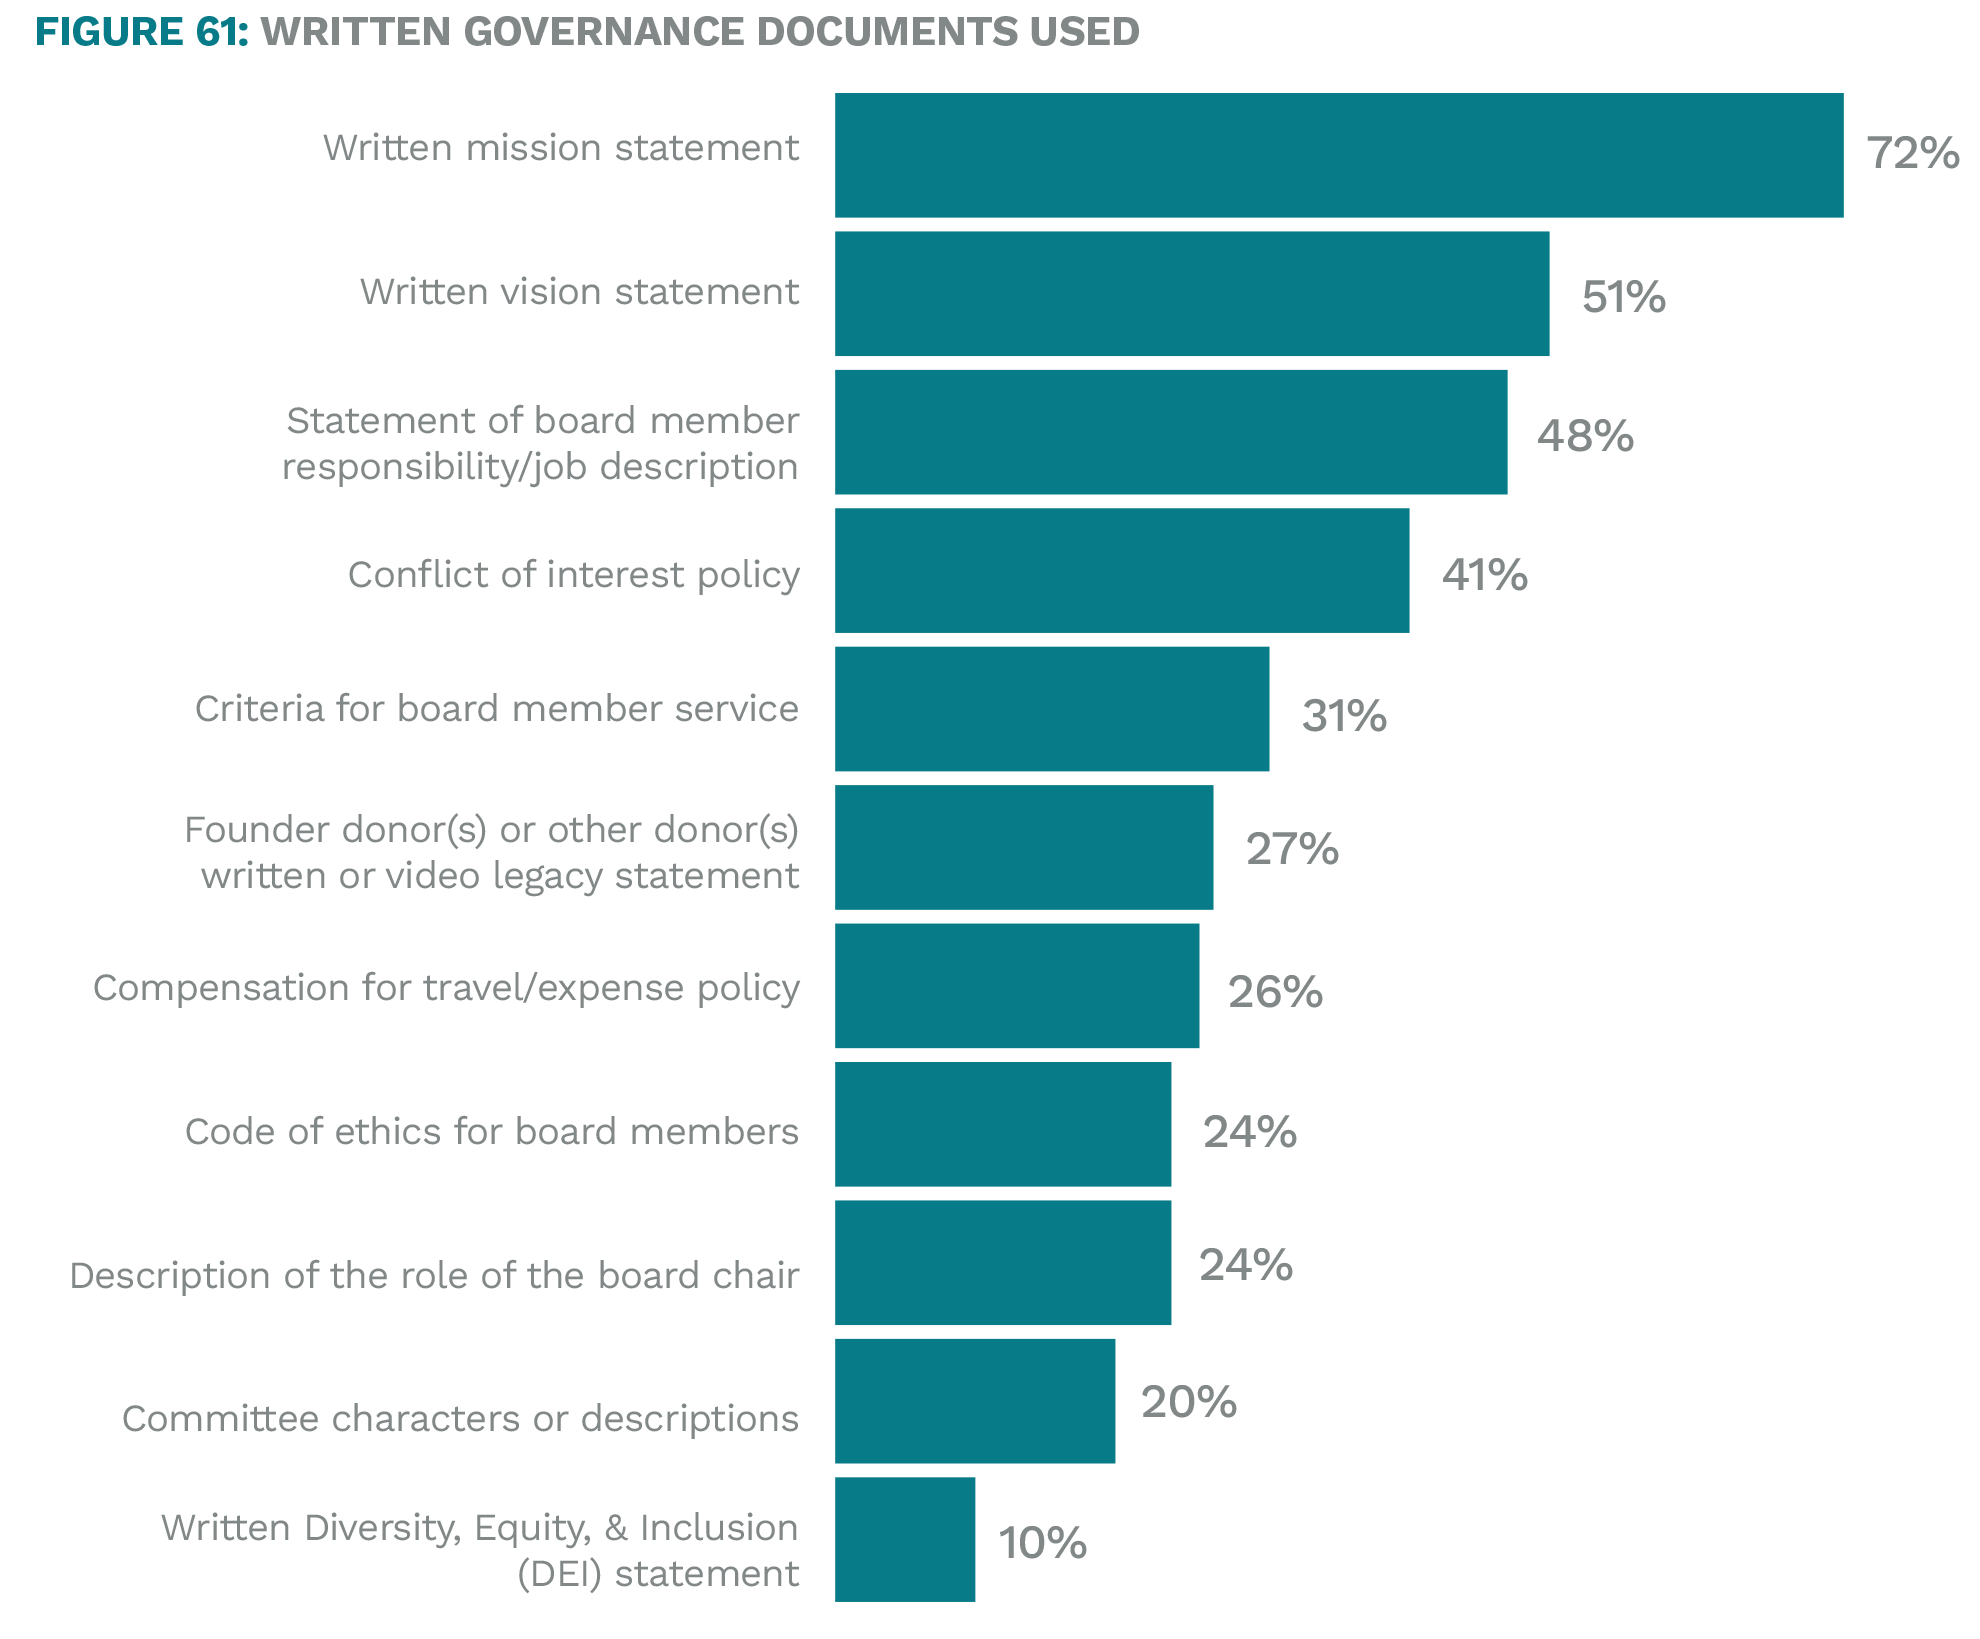
Governance Policies and Practices
The vast majority of family foundations have a written mission statement, but very few have written DEI statements. About half have a written vision statement and a statement of board member responsibilities. Not surprisingly, larger family foundations who are likely to have been in existence longer and have dedicated staff are mostly likely to use written governance documents.
Conversely, the newest family foundations are notably more likely to have a written mission statement (91%), vision statement (70%), and statement of board member responsibilities (73%). While it is unclear why this is the case, one possible explanation is the increasing awareness of these documents as guiding tools for philanthropy, and readily available examples and templates to choose from.
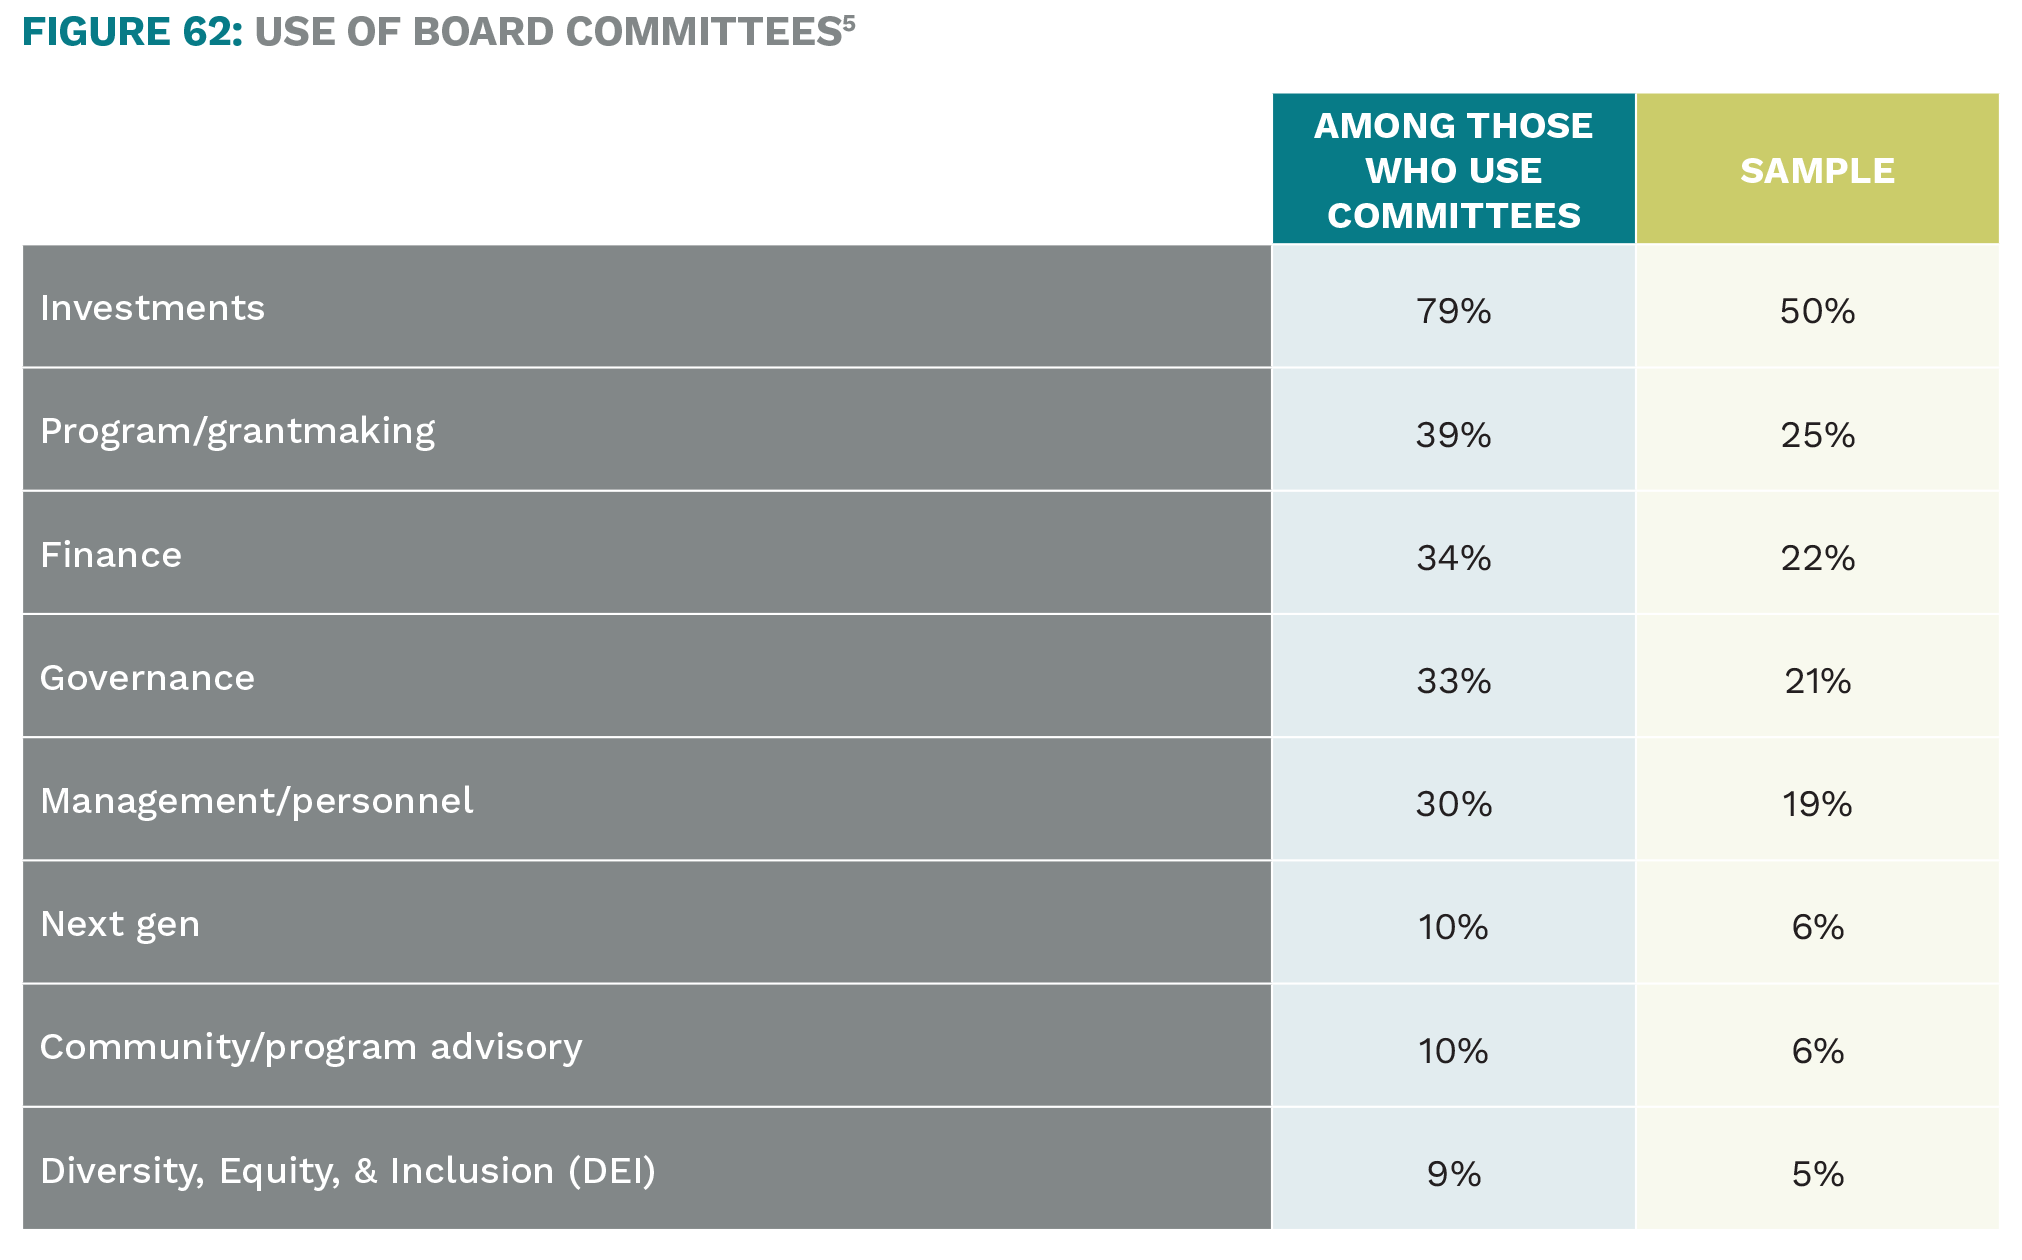
Board Committees
About two-thirds of family foundations have at least one committee or advisory group, the most common of which is an investment committee/advisory group (50% of all respondents). Foundations created before 1970 (81%) and after 2010 (74%) are most likely to use committees. Just as in 2015, the top three types of committees used are investments, program/grantmaking, and finance. Fewer report use of next-gen board committees today versus 2015.
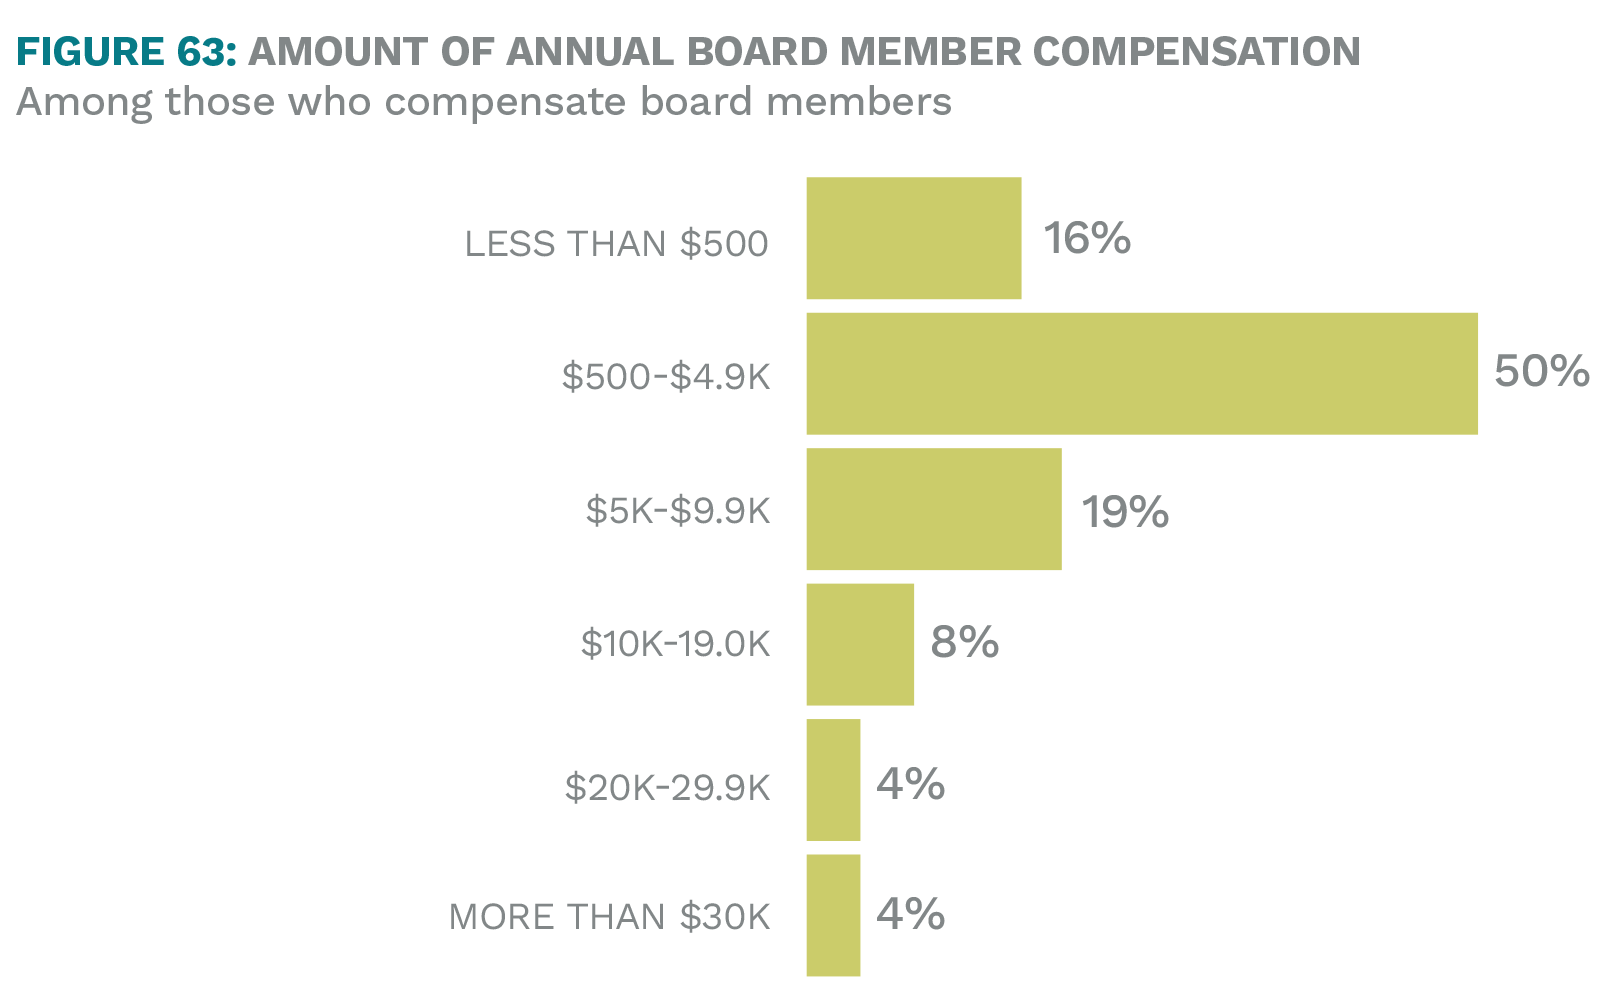
Board Compensation and Expense Reimbursement
Most family foundations do not compensate board members for service beyond reimbursable expenses: 35% pay modest stipends, while another 30% reimburse out-of-pocket expenses only. 35% do not pay fees or reimburse expenses.
The largest family foundations are more likely to provide compensation beyond expenses, with 39% of family foundations with $200M or more in assets paying $5,000 per year or more in compensation (compared to only 13% for all other asset levels).
Overall, only 12% of family foundations paid more than $5,000 per year in compensation. Among foundations created since 2010, none paid more than $5,000 per year in compensation; among those created from 1990 to 2009, only 8% did so.
5 Question wording varies slightly between 2015 and 2020. In 2015, the survey asked “Does the board use committees or advisory groups to perform the following activities?” In 2020, the survey asked “Does the board have any of the following committees or advisory groups?”
Staff Composition: Family VS. Non-Family
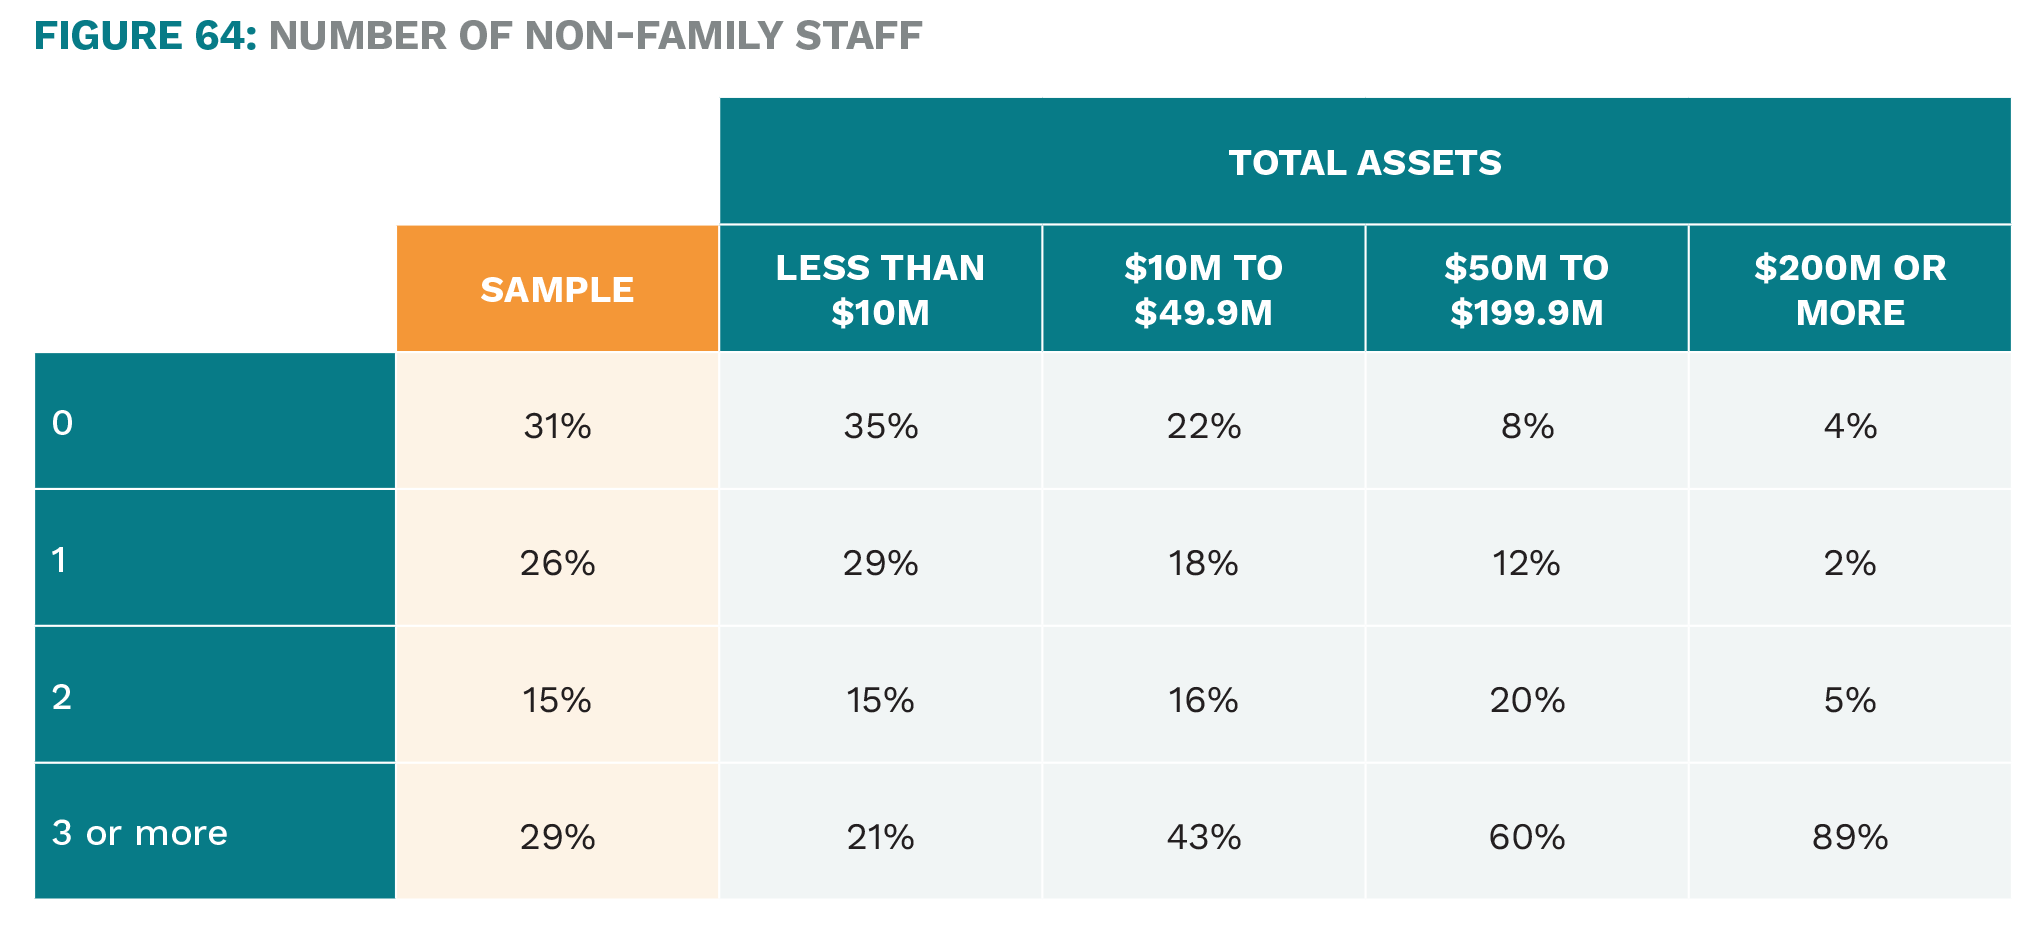
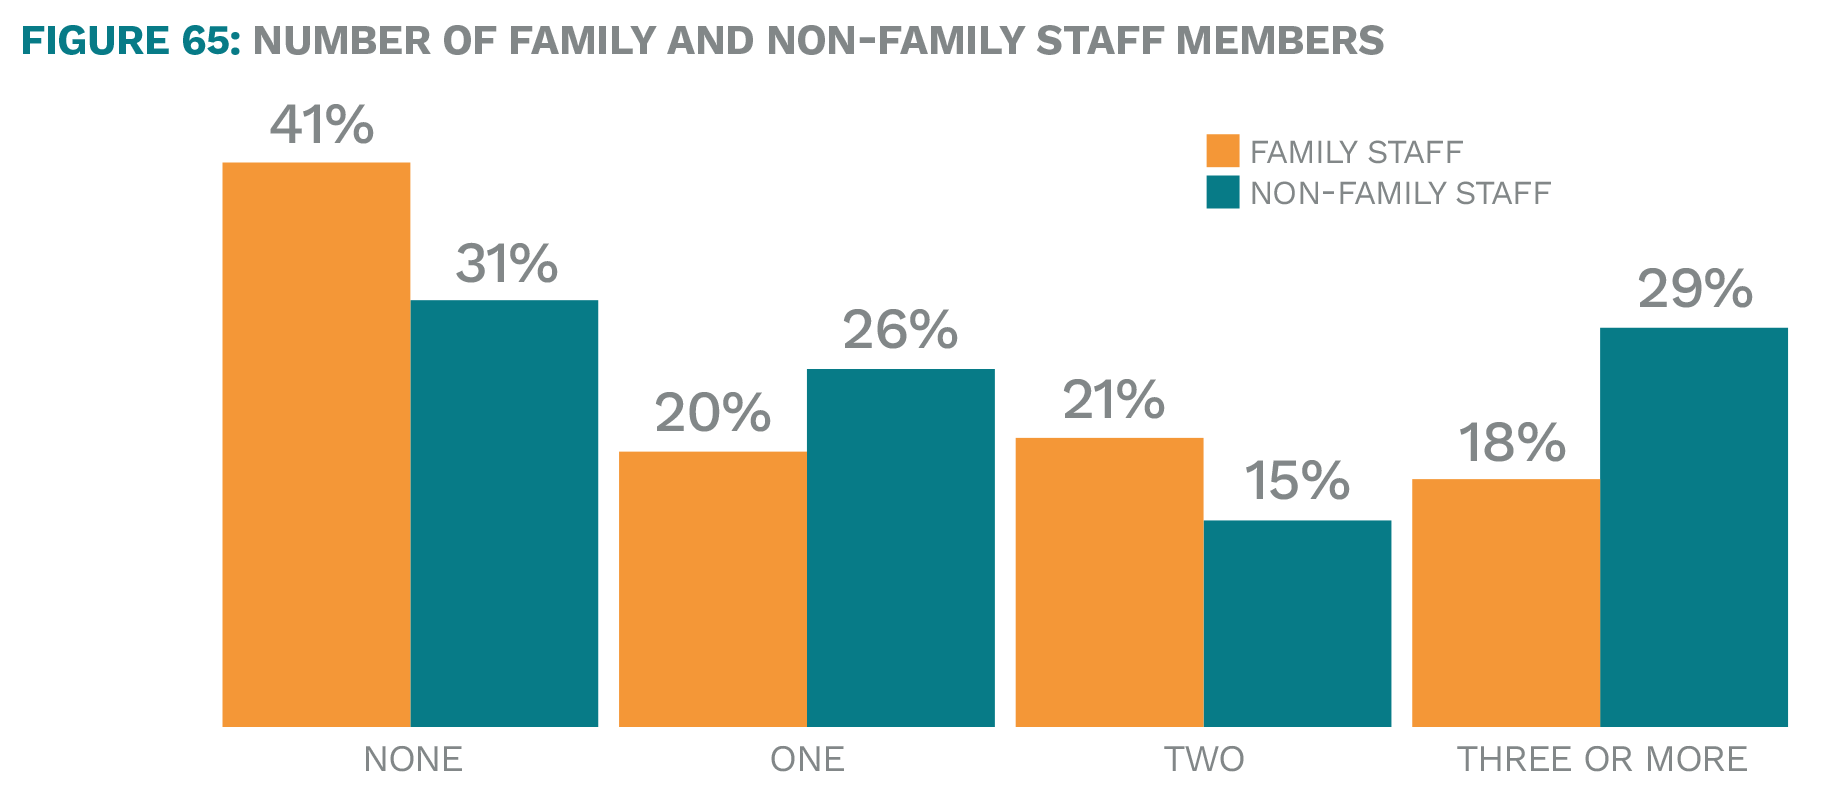
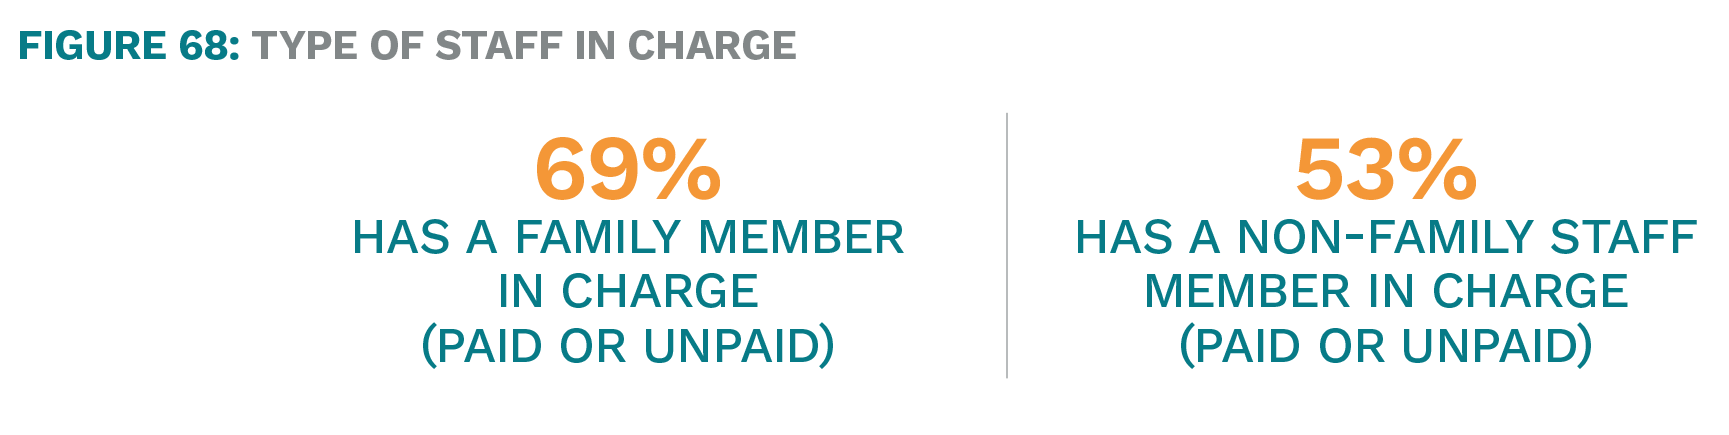
Nearly 70% of family foundations have non-family staff working for the foundation. About 60% have family staff members.
As the size of the foundation increases, the prevalence of non-family staff increases as well, with nearly nine in ten foundations with $200M or more in assets having three or more non-family staff.
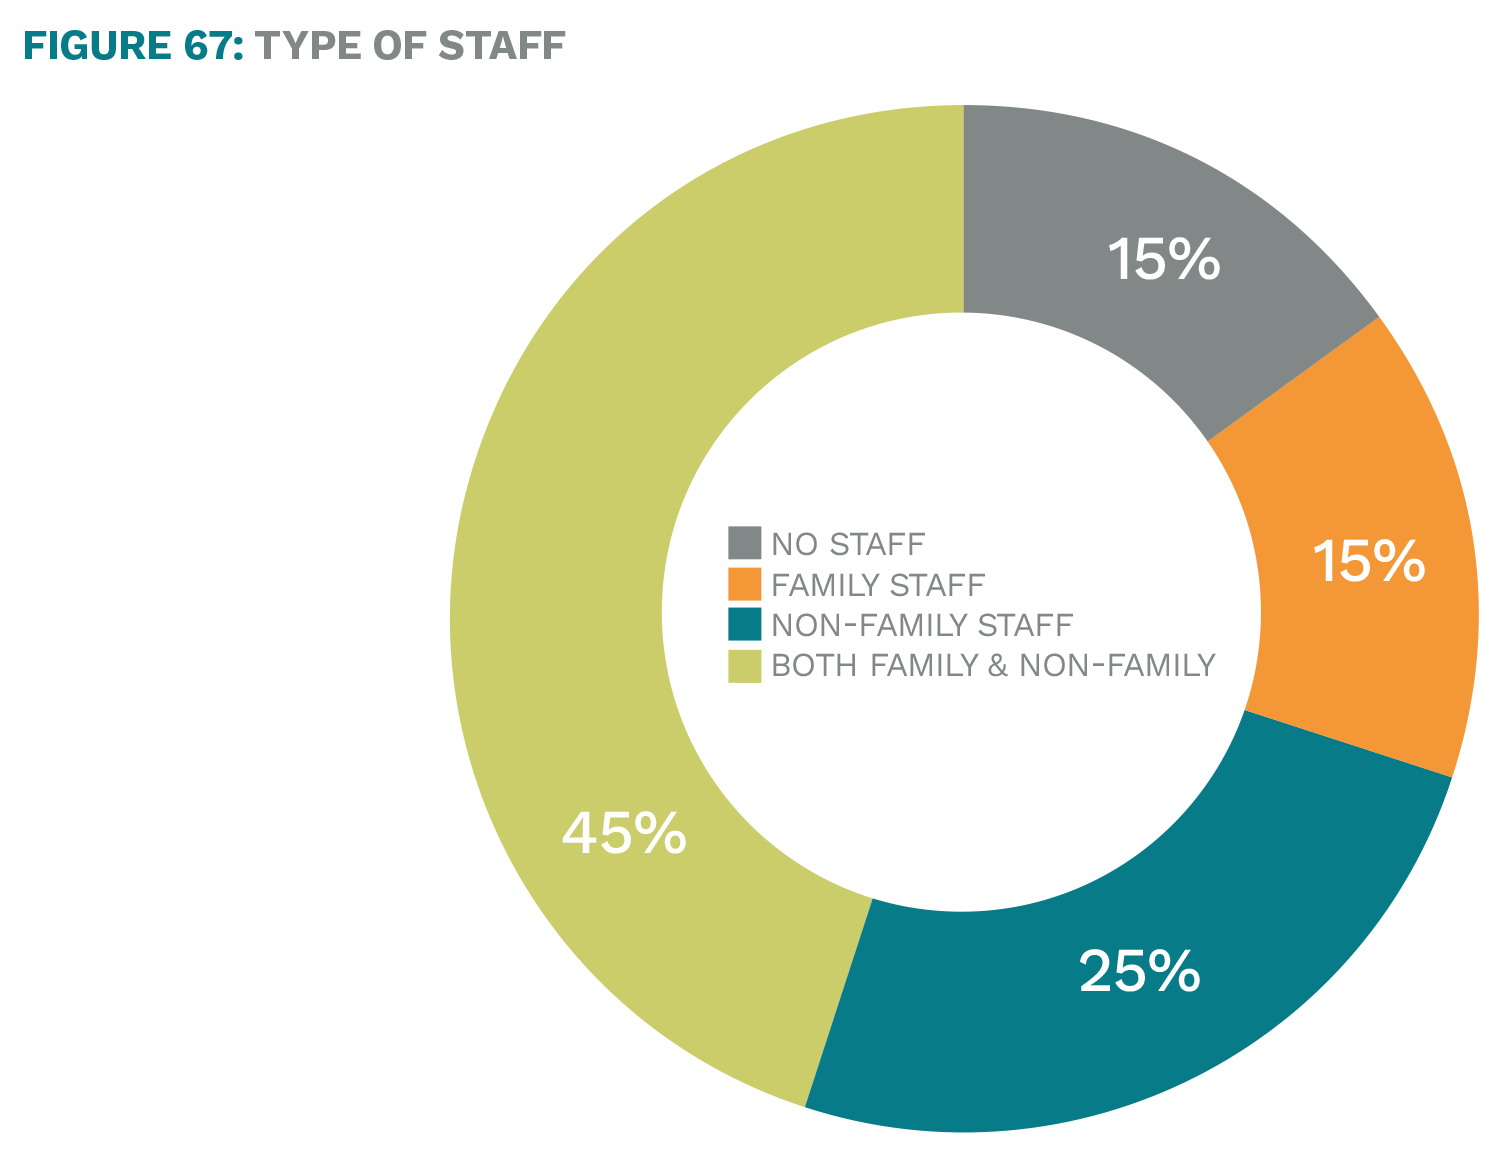
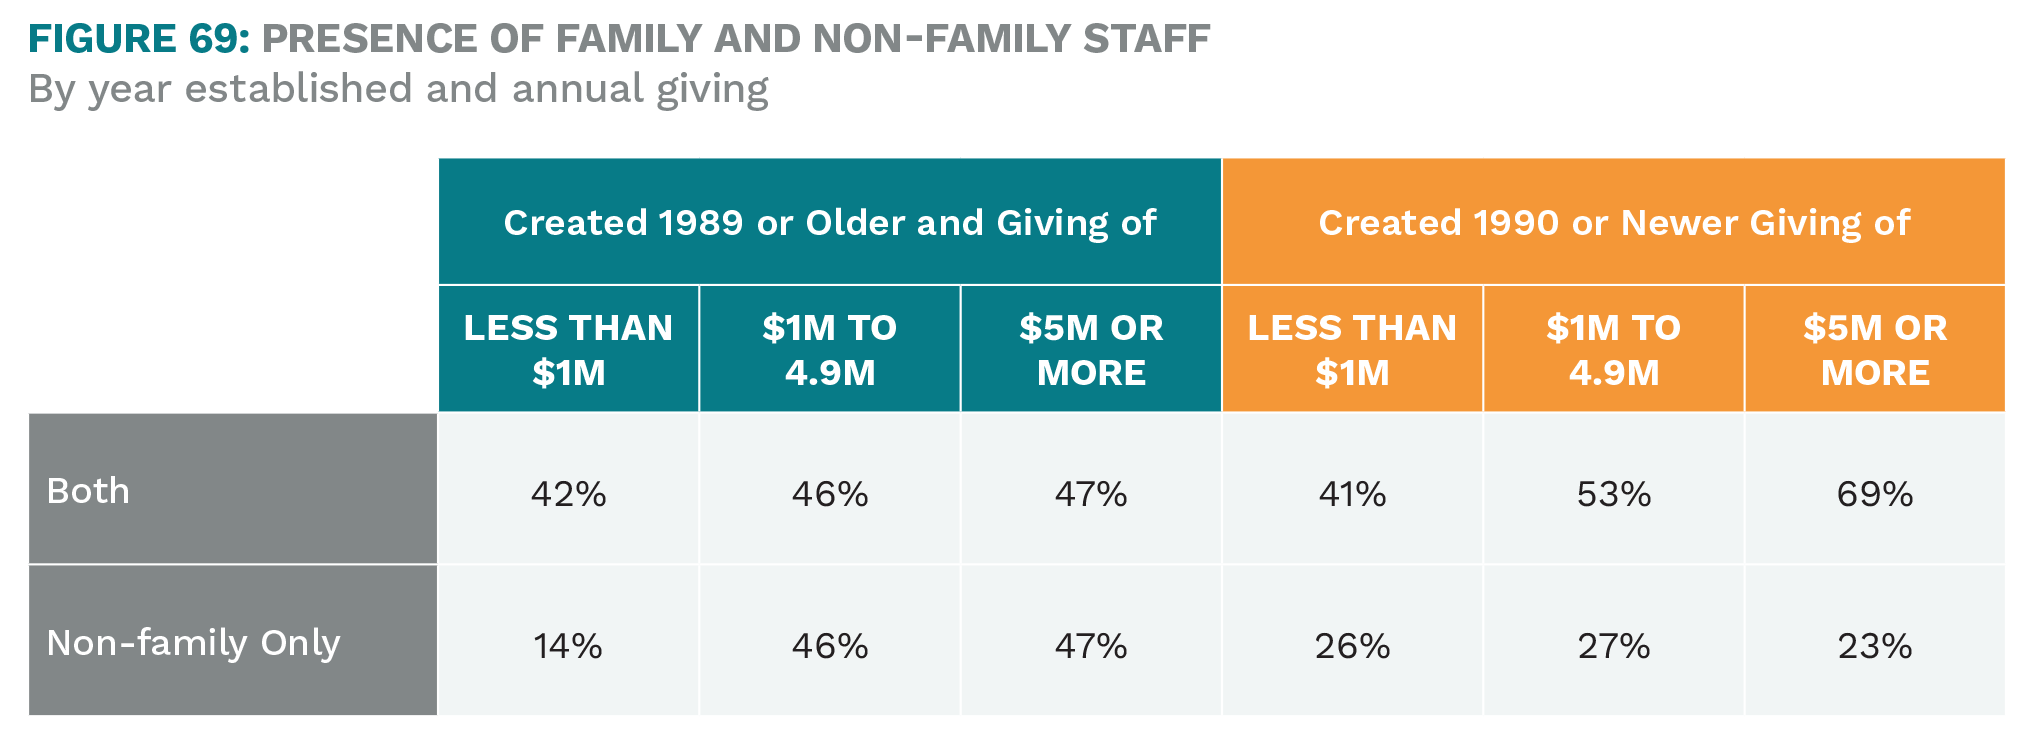
About two-fifths of all family foundations have both family and non-family staff working for the foundation, and one-fourth have non-family staff only.
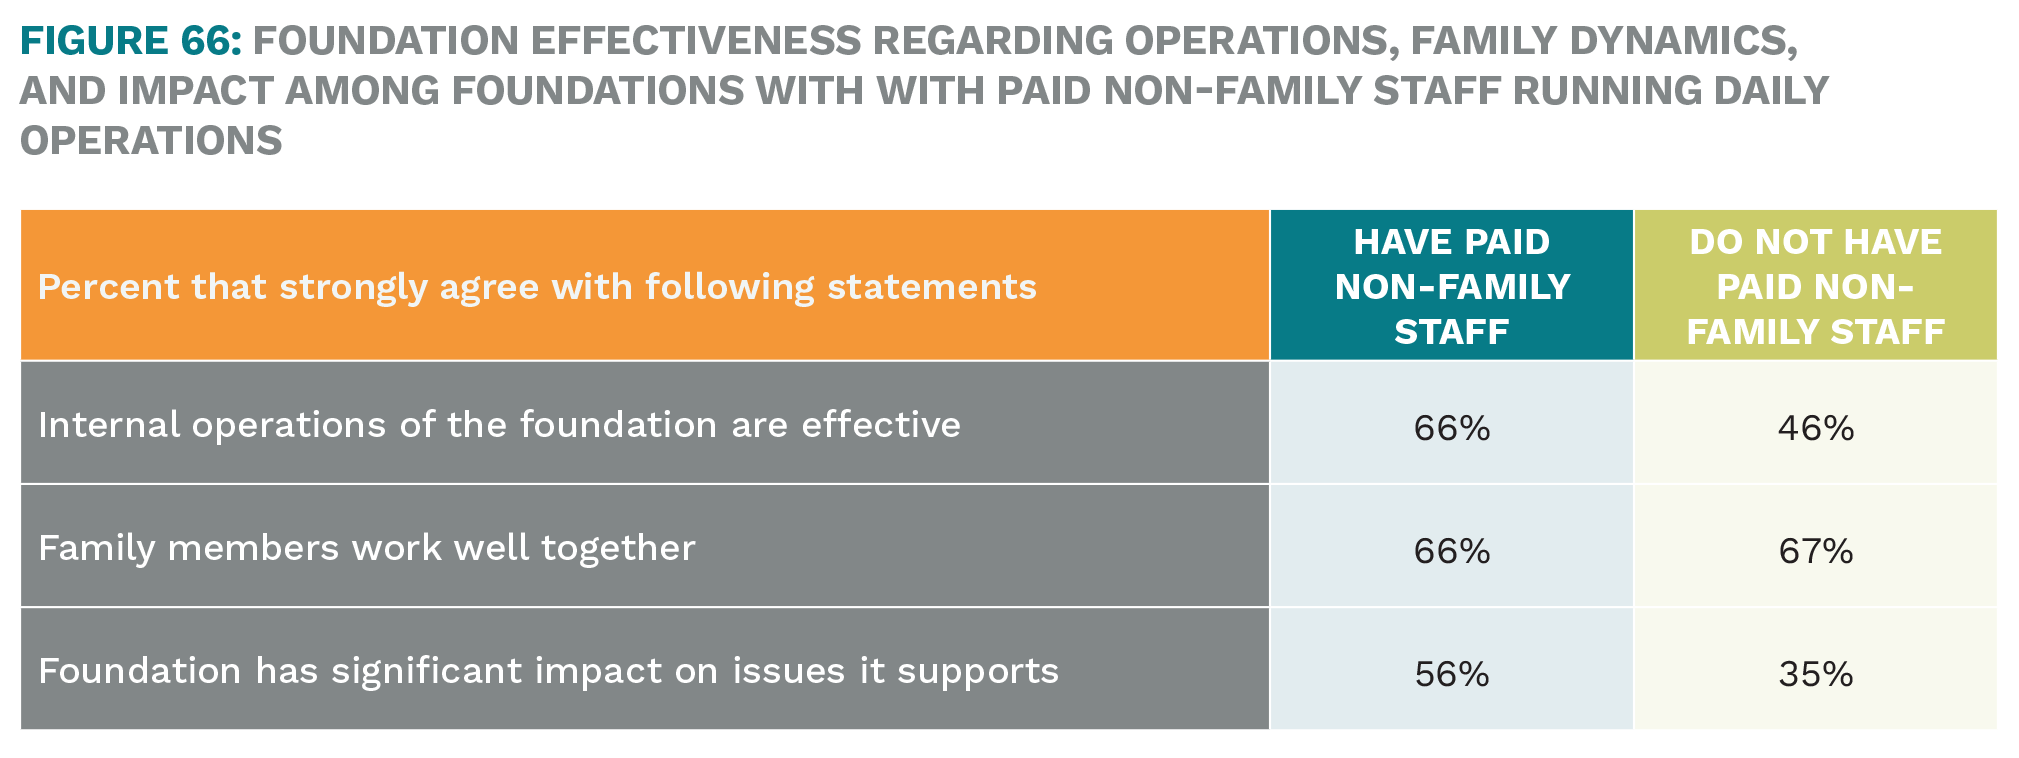
In general, foundations with paid non-family staff are more likely to strongly agree that they are effective in the areas of internal operations and impact on issues.
The likelihood of having non-family staff exclusively is highest among older/larger foundations, while both types of staff is most common among newer/larger foundations.
Day-to-Day Operations
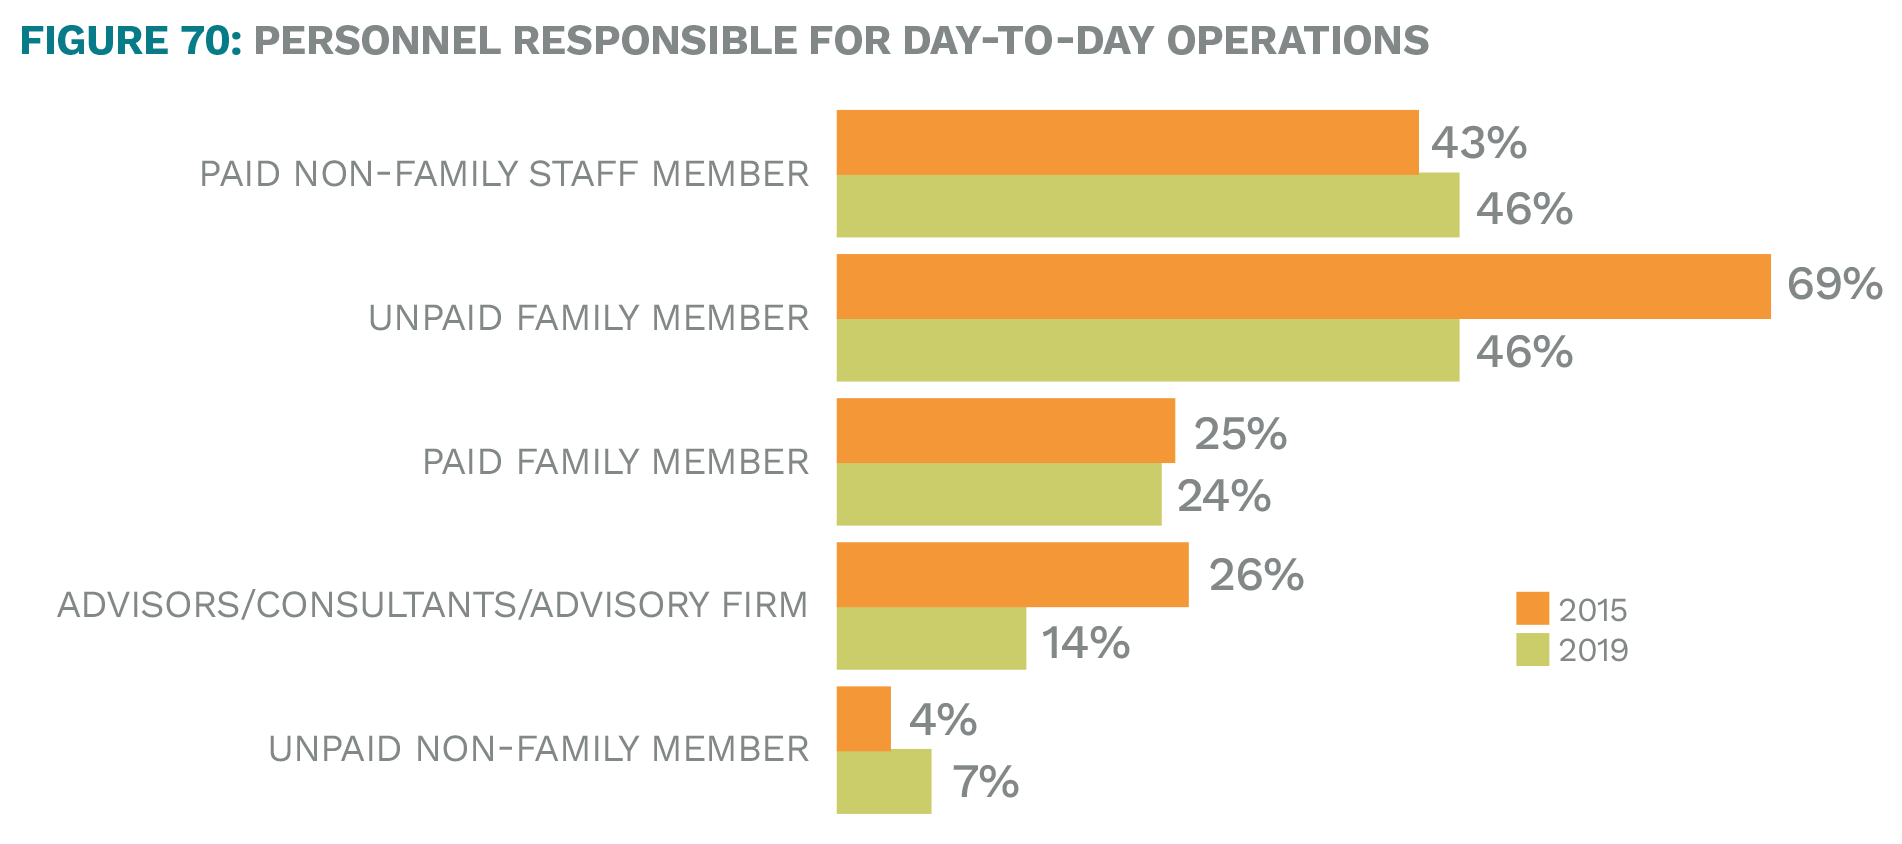
Typically, in family foundations, a paid non-family or an unpaid family member manages the day-to-day operations. Consistent with 2015, for 16% of family foundations, a paid non-family member and unpaid family member share this responsibility.
Responsibility for the day-to-day operations has shifted some since 2015, and today, fewer unpaid family members and consultants have this responsibility.
Not surprisingly, the largest foundations are most likely to have paid non-family members in charge.
Staff Addition
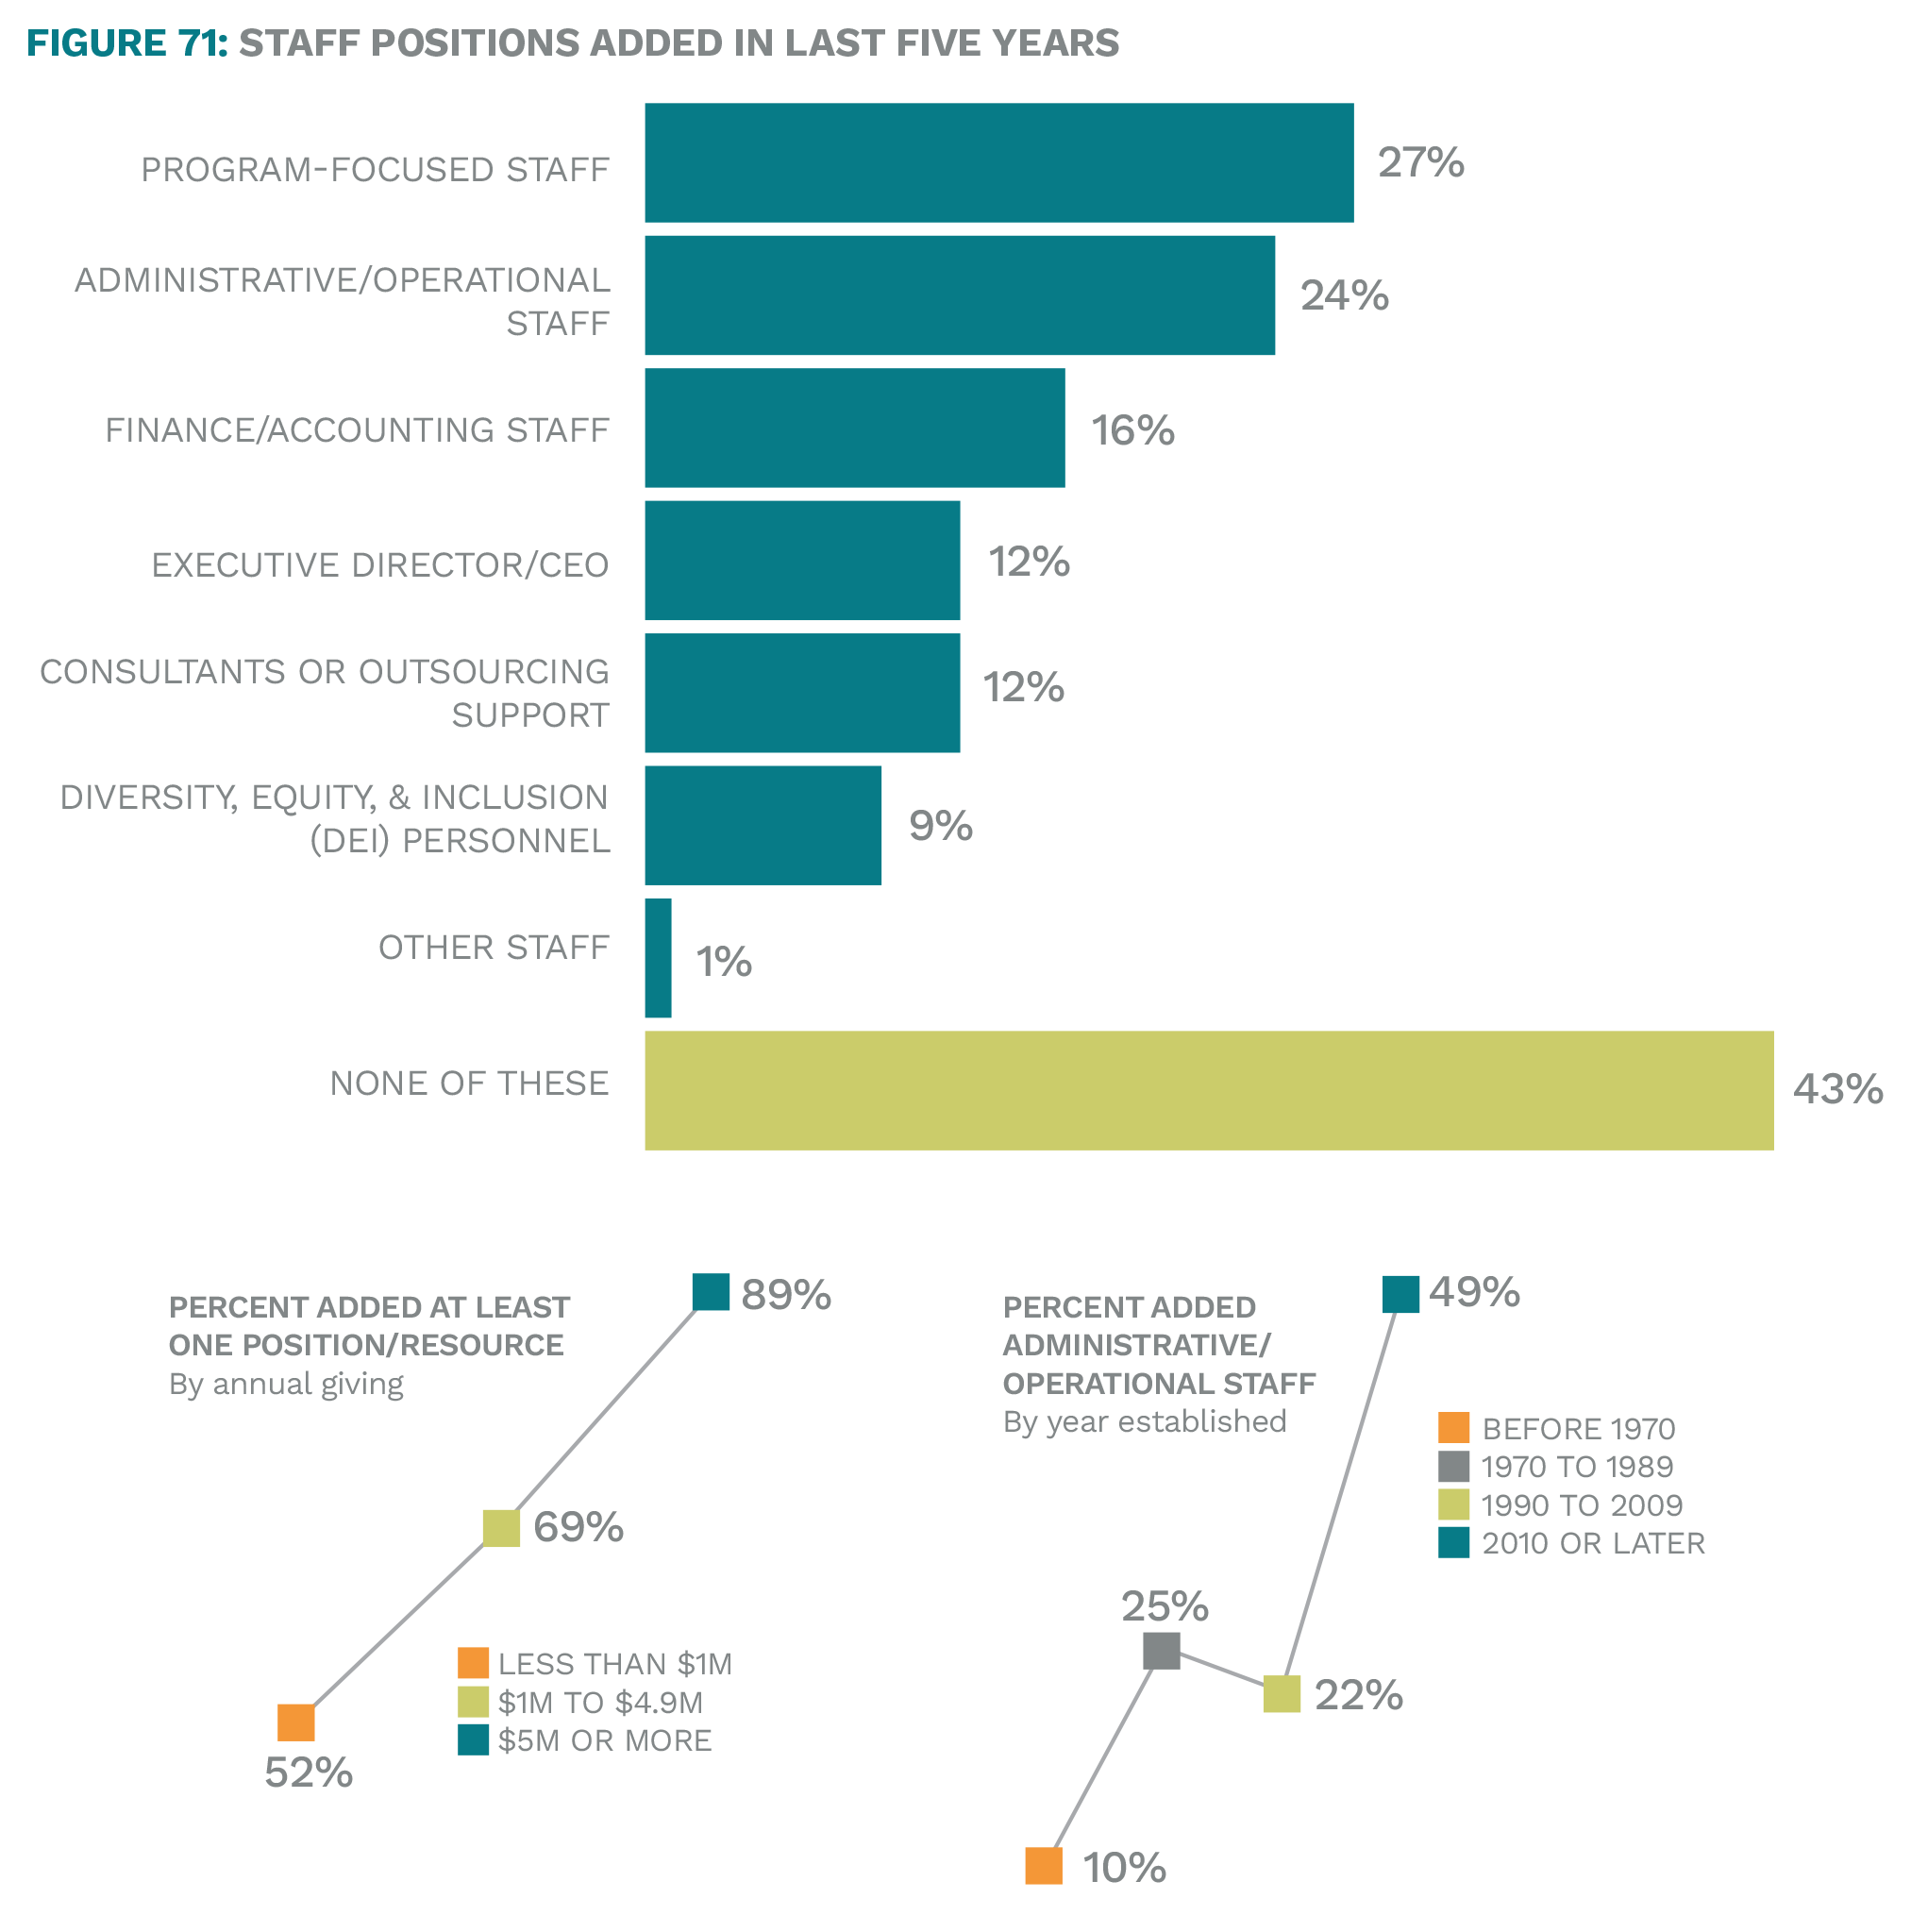
Over the past five years, foundations have most commonly added program-focused and administrative staff. The largest foundations are most likely to have added staff/resources. The newest foundations are notably more likely than others to have added administrative/operational staff in recent years.
Look to the Future
Foundations with non-family staff running daily operations appear to be much more likely to be currently considering techniques to enhance transparency and communications in the future. They also express more interest in exploring or expanding new grantmaking and investment strategies.
![]()