How Can My Family Foundation Use Data Visualization to Better Tell Our Story?
Memos and metrics, emails and texts, newsletters and reports: Is your organization suffering from information overload? We consume 34 gigabytes, or 100,500 words, of information every day. Our brains are overwhelmed and struggling to keep up.
Data visualization–or dataviz–is one of the strongest weapons against information overload. Colorful diagrams, well-designed charts, and engaging infographics are easy to digest and fun to share. Dataviz can get your colleagues to pay attention to your organization’s most important data. Dataviz can captivate and catalyze your supporters. And dataviz can increase your communication power with pretty much every audience you’re hoping to inform or sway.
So get started! Here’s an overview of my step-by-step dataviz design process.
Step 1: Select a single message to highlight in your chart
We’re spending less time reading and more time skimming than ever before. We need simple, skimmable charts. We want our audience to grasp our takeaway message within seconds.
Think about a single message worth highlighting in a chart. Sometimes it takes a while to figure out which patterns are worth showcasing and which chart type is best for that data. I use sparklines and conditional formatting to explore options in Excel.
I also sketch, draw, and doodle plenty of drafts before I create anything on my computer:
If you’re not sure which chart to use, start with a bar chart or line chart. Later on, once you’ve mastered the basics, try dot plots, slopegraphs, social network maps, tree maps, or waterfall charts.
Finally, create your chart in a computer program. I use Excel for 90% of my charts. (And if you’re just getting started with Excel, check out my free tutorials at annkemery.com/excel.
Step 2: Reduce the clutter
Now it’s time to edit, edit, edit. You’re going to need to delete or lighten a lot of the chart’s clutter (the border, grid lines, and tick marks). Examine each and every speck of ink on the chart. Does it have a specific purpose? If you can’t articulate a reason for that ink, you don’t need it.

Step 3: Directly label
Don’t make your reader hunt for numbers. Direct labels save time and guesswork.

Step 4: Emphasize key findings with color
Our eyes are drawn to darker, saturated colors. Use an action color (like a dark blue, green, or red from your organization’s logo) to direct your audience’s attention to your most important finding.

Step 5: State your takeaway message in the title
Rather than generic titles (“Figure 1″), state the story in the title. Think Twitter-like! Try to fit your story within 6-8 words. Need more details? Add a 2-3 sentence caption underneath the title.

Step 6: Are you doing it right? Two tests
Woohoo! You’re almost finished. Check your progress with these two tests.
The Squint Test: Squint your eyes so that you’re peering at the chart through your eyelashes. Everything should look a little blurry. Can you see the overall shape of the data? For example, you should be able to tell if a line chart is jutting upwards or downwards over time. If not, try removing more clutter.
The Significant Other Test: Give a draft of your chart to a significant other or coworker. Ask, “What’s the central message in this chart?” If they hesitate more than a few seconds, or if their story doesn’t align with your intended story, try working on your title and caption.
Step 7: Adapt your chart to fit different communications modes
The final step in my Dataviz Design Process is adapting your chart to fit different communications modes, like live presentations, webinars, handouts, and social media.
Charts within live presentations or webinars: For complicated charts–or to make a bang in your presentation–break up the slide’s content into several slides. See the example below from Cole Nussbaumer about creating “animation.”
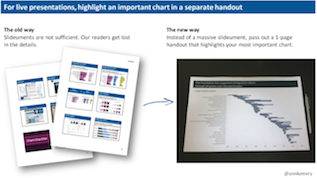
Charts as the star of a one-page handout: We often print our full slideset for our audience. However, slideuments are not sufficient handouts because our audience gets lost in pages and pages of details. One strategy is to produce a separate one-page handout with your most important chart. Now, the audience will walk away from your presentation with a crystal clear picture of the key message you wanted them to hear.

Charts in social media: Planning to tweet a chart or two? Twitter images have a 2:1 aspect ratio. This means that when you’re scrolling through your Twitter feed, the images automatically display about twice as wide as they are tall. Make sure you adjust your charts to fit a 2:1 aspect ratio; otherwise your carefully crafted title will get cut off.
Want to learn more?
Want more details? You can check out more presentations and tutorials on my blog like DataViz for Philanthropists. And here are a few of my favorite dataviz resources:
- Edward Tufte’s The Visual Display of Quantitative Information is a great guide for beginners.
- Cole Nussbaumer and Stephanie Evergreen blog about using Excel for data visualization. They both offer free downloads like chart templates.
- ThumbsUpViz.com is a library of stellar dataviz examples.
- If you’re looking for inspiration, follow these data journalism teams: @PostGraphics, @NYTgraphics, and @WSJgraphics.
Happy charting!